Home /
Expert Answers /
Statistics and Probability /
data-for-high-school-dropout-rates-for-a-certain-school-district-were-collected-for-the-years-2010-a-pa831
(Solved): Data for high school dropout rates for a certain school district were collected for the years 2010 a ...
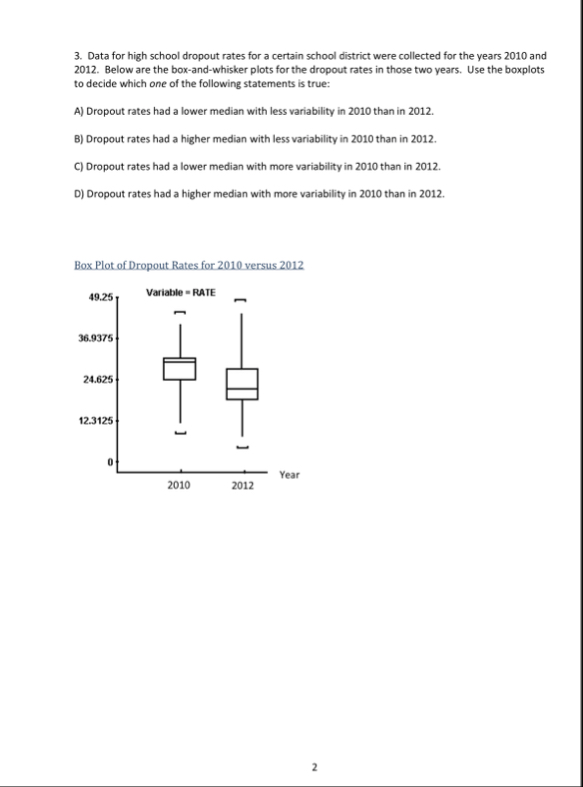
Data for high school dropout rates for a certain school district were collected for the years 2010 and 2012. Below are the box-and-whisker plots for the dropout rates in those two years. Use the boxplots to decide which one of the following statements is true: A) Dropout rates had a lower median with less variability in 2010 than in 2012. B) Dropout rates had a higher median with less variability in 2010 than in 2012. C) Dropout rates had a lower median with more variability in 2010 than in 2012. D) Dropout rates had a higher median with more variability in 2010 than in 2012. 2