Home /
Expert Answers /
Computer Science /
data-set-jupyter-notebook-a-read-the-dataset-39-eng-salaries-csv-39-using-pandas-3-b-check-shape-an-pa687
(Solved): DATA SET:jupyter notebook a. Read the dataset 'Eng_salaries.csv' using pandas. (3) b. Check shape an ...
DATA SET:
jupyter notebook
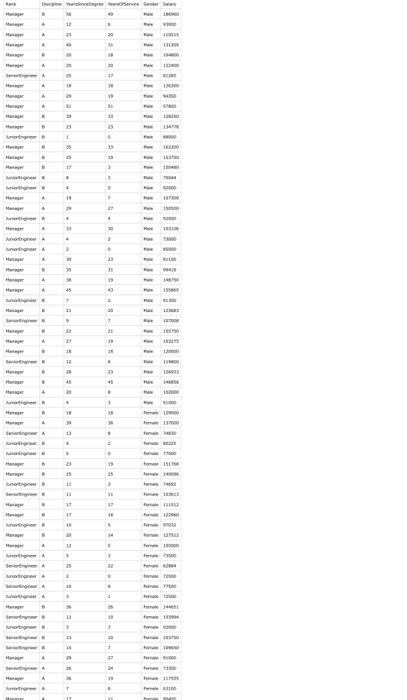
a. Read the dataset 'Eng_salaries.csv' using pandas. (3) b. Check shape and size of the dataset. (1+1) c. Print first 10 rows of the data. (2) d. Get rid of 'Discipline' column. (2) e. Drop the rows with missing values. (2) How many rows got dropped? (write this answer in words and comment out). (1) f. Provide a summary statistics of the data. (4) g. Calculate the mean and standard deviation of salary for each rank. (6) h. Now, calculate minimum, mean, and maximum of the Salary, YearsOfService together (not separately). (8) i. Print \( 10^{\text {th }} \) to \( 25^{\text {th }} \) indexed rows for the columns Rank, YearsSincePhd, and Salary. (5) j. Sort the data by salary and then by YearsOfService in descending order. (4) k. Compare the salary for male vs female by creating an appropriate chart. Use green color for the chart. The chart must have title, axes labels, and legend. Whose salary is higher between male and female (write this answer in words and comment out)? \( (6+1) \) I. Create a joint plot to check the relationship between YearsSinceDegree and salary. Is the relationship positive or negative (write this answer in words and comment out)? \( (6+1) \) \( \mathrm{m} \). Is the YearsSinceDegree data normally distributed (write this answer in words and comment out)? Check that by creating an appropriate chart. \( (1+6) \)
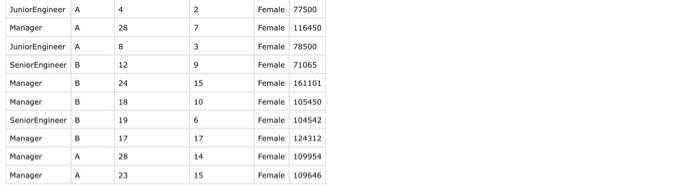
\begin{tabular}{|l|l|l|l|l|l|} \hline JuniorEngineer & A & 4 & 2 & Femaie & 77500 \\ \hline Manager & A & 28 & 7 & Female & 116450 \\ \hline funiorEngineer & A & 8 & 3 & Female & 78500 \\ \hline SeniorEngineer & B & 12 & 9 & Female & 71065 \\ \hline Manager & 8 & 24 & 15 & Female & 161101 \\ \hline Manager & B & 18 & 10 & Female & 105450 \\ \hline Seniortingineer & B & 19 & 6 & Female & 104542 \\ \hline Manager & B & 17 & 17 & Female & 124312 \\ \hline Manager & A & 28 & 14 & Female & 109954 \\ \hline Manager & A & 23 & 15 & Female & 109646 \\ \hline \end{tabular}
Expert Answer
(a) df=pd.read_csv('Eng_salaries.csv') (b) df.shape df.size (c) df.head(10) (d) df.drop(['Discipline'], axis=