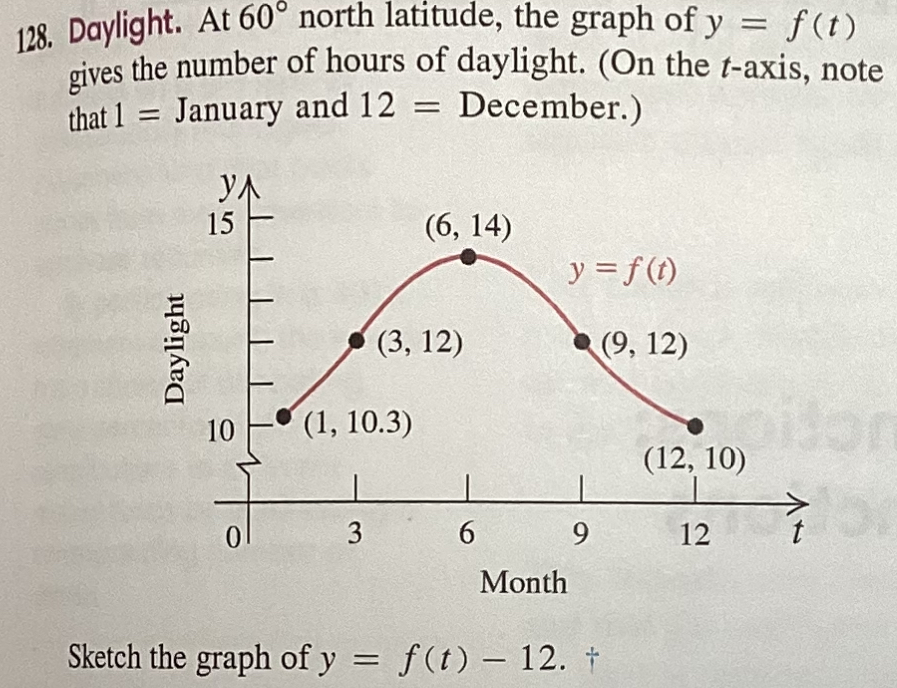
Daylight. At
60\deg
north latitude, the graph of
y=f(t)
gives the number of hours of daylight. (On the
t
-axis, note that
1=
January and
12=
December.) Sketch the graph of
y=f(t)-12
.