Home /
Expert Answers /
Statistics and Probability /
draw-a-graph-for-the-standard-normal-distribution-label-the-horizontal-axis-at-values-of-3-2-pa594
(Solved): Draw a graph for the standard normal distribution, Label the horizontal axis at values of \( -3,-2, ...
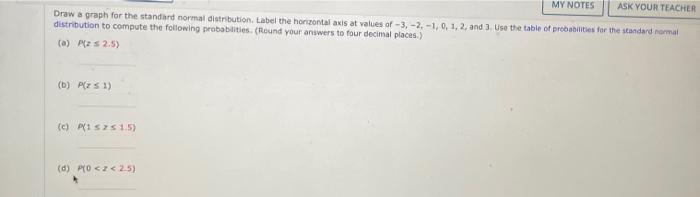
Draw a graph for the standard normal distribution, Label the horizontal axis at values of \( -3,-2,-1,0,1,2 \), and 3 , Use the table of prebabilities far the seandard normal distribution to compute the following probablities. (Reunid your answers to four decimal places.) (a) \( P\{z \leq 2,5\} \) (b) \( P(r \leq 1) \) (c) \( P\{1 \leq 2 \leq 1.5\} \) (d) \( P(0<2<2 \leq 2) \)
Expert Answer
Here is your answer- Solution: Z is the standard normal distribution variable We need to calculate following probabilities as follows Solution(a) P(z