Home /
Expert Answers /
Precalculus /
draw-the-following-graph-on-the-interval-105-lt-x-lt-765-cos-2-37-5-60-2-a-60-120-18-pa644
(Solved): Draw the following graph on the interval -105 < x < 765: cos (-2+37.5) -60 2 A 60 120 18 ...
Draw the following graph on the interval -105° < x < 765°: cos (-2+37.5°) -60 2 A 60 120 180 240 300 360 420 480 540 600 660 720 -2 Clear All Draw: y = <= COS ww
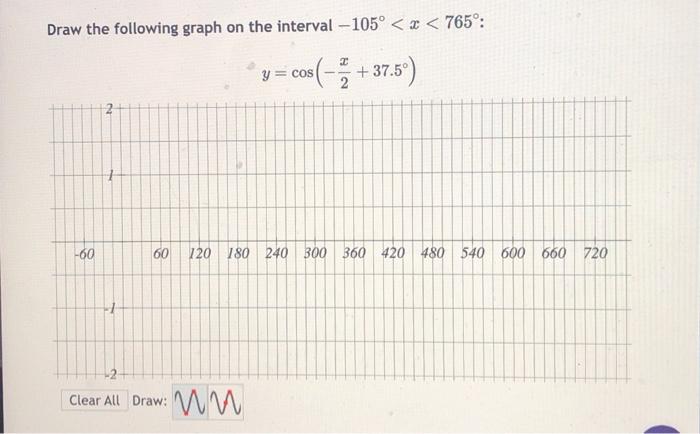
Draw the following graph on the interval :