(Solved): E15-17. Contribution Income Statement and Cost-Volume-Profit Graph Picnic Time produces a picnic b ...
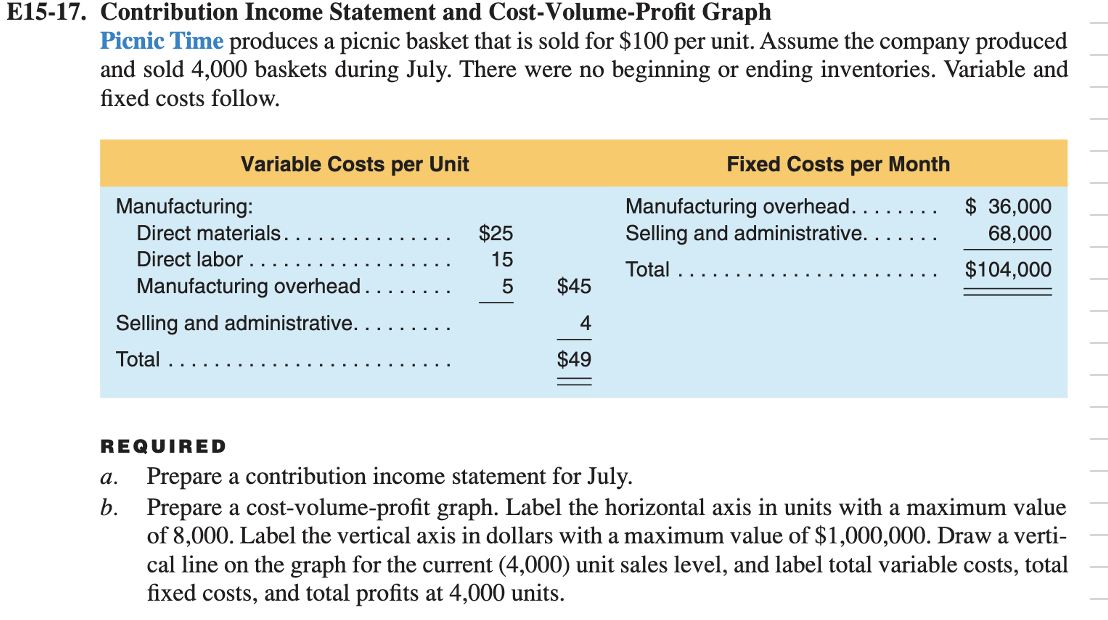
E15-17. Contribution Income Statement and Cost-Volume-Profit Graph Picnic Time produces a picnic basket that is sold for $100 per unit. Assume the company produced and sold 4,000 baskets during July. There were no beginning or ending inventories. Variable and fixed costs follow. Variable Costs per Unit Manufacturing: Direct materials: $25 Direct labor: $15 Manufacturing overhead: $5 Selling and administrative: $4 Total: $49 Fixed Costs per Month Manufacturing overhead: $36,000 Selling and administrative: $68,000 Total: $104,000 Required: a. Prepare a contribution income statement for July. b. Prepare a cost-volume-profit graph. Label the horizontal axis in units with a maximum value of 8,000. Label the vertical axis in dollars with a maximum value of $1,000,000. Draw a vertical line on the graph for the current (4,000) unit sales level, and label total variable costs, total fixed costs, and total profits at 4,000 units.