Home /
Expert Answers /
Economics /
economic-fluctuations-ii-the-following-graph-shows-the-aggregate-demand-curve-ad-the-short-run-ag-pa512
(Solved): Economic fluctuations II The following graph shows the aggregate demand curve (AD), the short-run ag ...
Economic fluctuations II
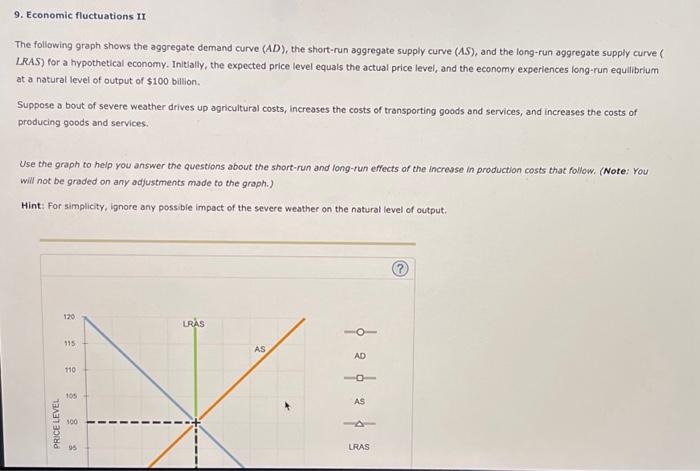
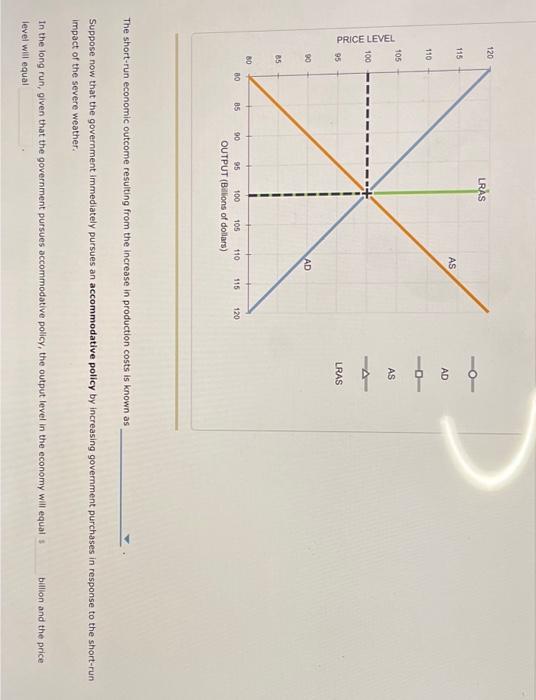
The following graph shows the aggregate demand curve (AD), the short-run aggregate supply curve (AS), and the long-run aggregate supply curve ( LRAS) for a hypothetical economy. Initially, the expected price level equals the actual price level, and the economy experiences long-run equilibrium at a natural level of output of billion. Suppose a bout of severe weather drives up agricultural costs, increases the costs of transporting goods and services, and increases the costs of producing goods and services. Use the graph to help you answer the questions about the short-run and long-run effects of the increase in production costs that follow. (Note: You will not be graded on any adjustments made to the graph.) Hint: For simplicity, ignore any poss ible impact of the severe weather on the natural level of output.