Home /
Expert Answers /
Statistics and Probability /
exercise-10-2-data-types-and-graph-exercise-using-the-data-provided-read-the-case-study-included-pa376
(Solved): Exercise 10.2: Data Types and Graph Exercise. Using the data provided, read the case study included ...
Exercise 10.2: Data Types and Graph Exercise. Using the data provided, read the case study included in the instructions on p. 199. In a well-organized response, answer the questions and create the graph you select to represent the data values for the visit time column.
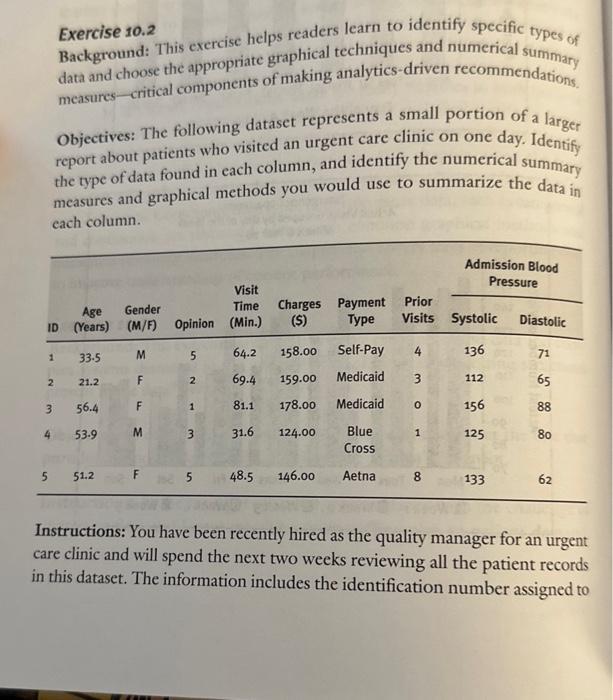
Exercise 10.2 Background: This exercise helps readers learn to identify specific types of data and choose the appropriate graphical techniques and numerical summary measures-critical components of making analytics-driven recommendations. Objectives: The following dataset represents a small portion of a larger report about patients who visited an urgent care clinic on one day. Identify the type of data found in each column, and identify the numerical summary measures and graphical methods you would use to summarize the data in each column. Instructions: You have been recently hired as the quality manager for an urgent care clinic and will spend the next two weeks reviewing all the patient records in this dataset. The information includes the identification number assigned to
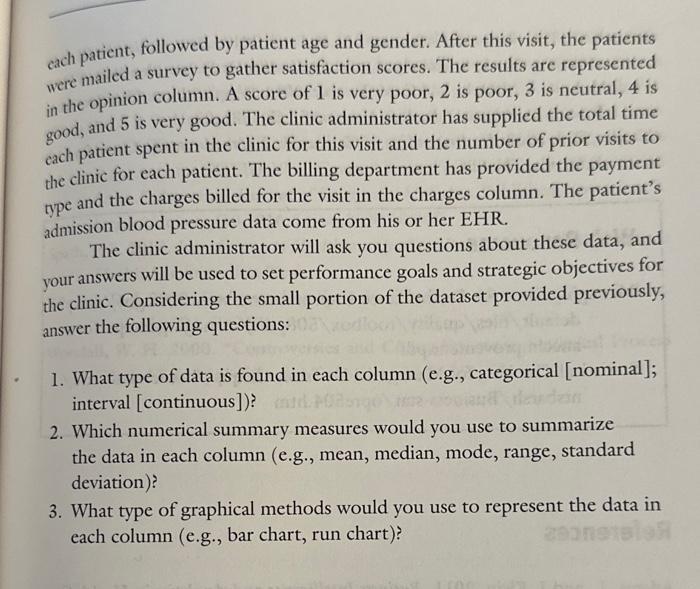
each patient, followed by patient age and gender. After this visit, the patients were mailed a survey to gather satisfaction scores. The results are represented in the opinion column. A score of 1 is very poor, 2 is poor, 3 is neutral, 4 is good, and 5 is very good. The clinic administrator has supplied the total time each patient spent in the clinic for this visit and the number of prior visits to the clinic for each patient. The billing department has provided the payment type and the charges billed for the visit in the charges column. The patient's admission blood pressure data come from his or her EHR. The clinic administrator will ask you questions about these data, and your answers will be used to set performance goals and strategic objectives for the clinic. Considering the small portion of the dataset provided previously, answer the following questions: 1. What type of data is found in each column (e.g., categorical [nominal]; interval [continuous])? 2. Which numerical summary measures would you use to summarize the data in each column (e.g., mean, median, mode, range, standard deviation)? 3. What type of graphical methods would you use to represent the data in each column (e.g., bar chart, run chart)?
Expert Answer
Solution:-The type of data found in each column are as follows:-Admission Blood Pressure: Continuou