Home /
Expert Answers /
Advanced Physics /
figure-1-intensity-as-function-of-position-for-double-slit-interference-as-measured-on-the-pa623
(Solved): FIGURE 1: INTENSITY AS FUNCTION OF POSITION FOR DOUBLE-SLIT INTERFERENCE AS MEASURED ON THE ...
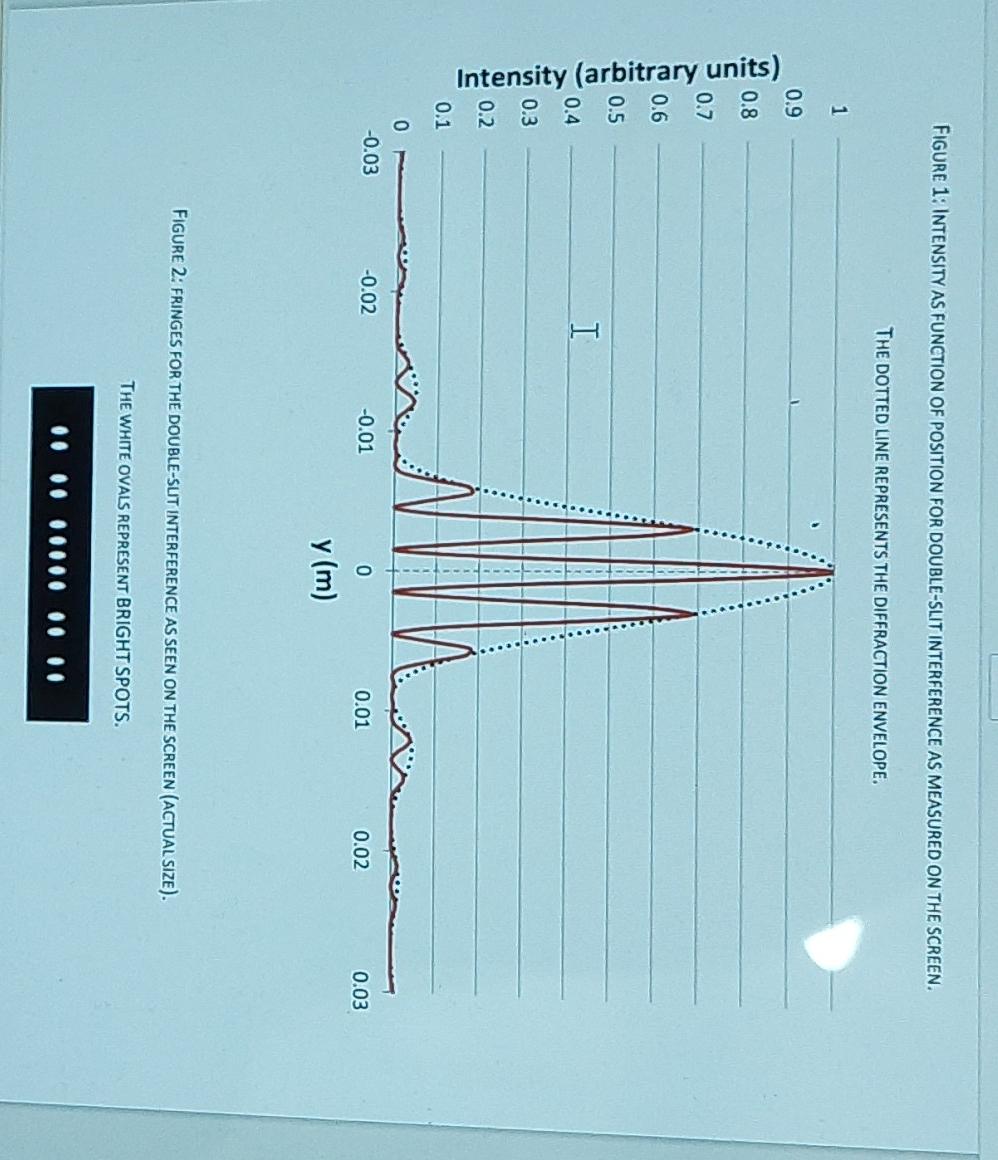
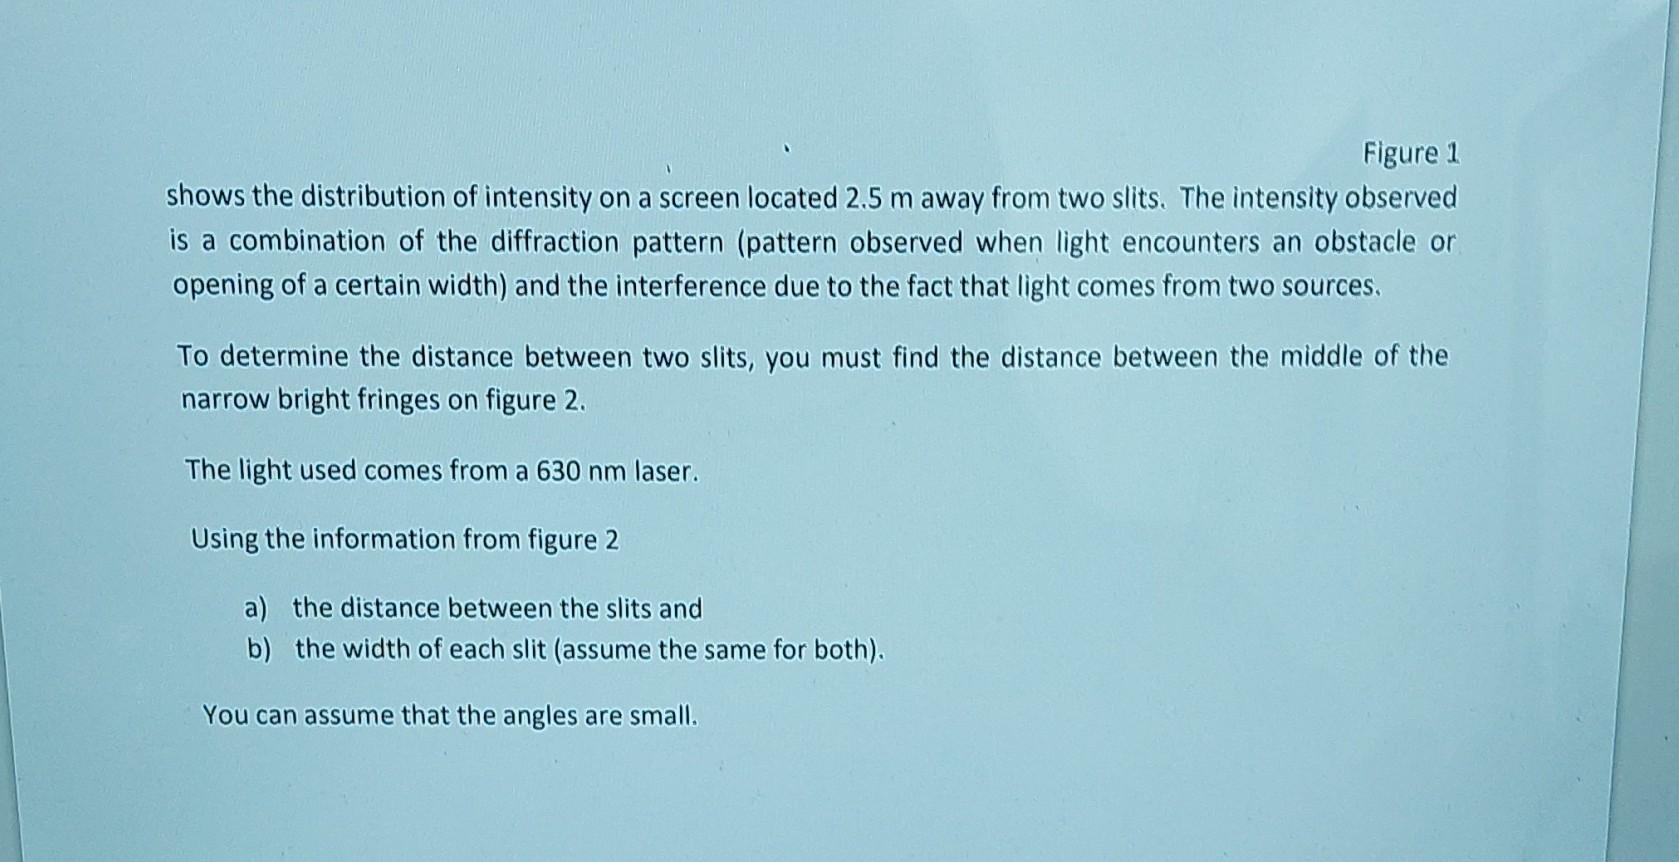
FIGURE 1: INTENSITY AS FUNCTION OF POSITION FOR DOUBLE-SLIT INTERFERENCE AS MEASURED ON THE SCREEN. THE DOTTED LINE REPRESENTS THE DIFFRACTION ENVELOPE. FIGURE 2: FRINGES FOR THE DOUBLE-SUT INTERFERENCE AS SEEN ON THE SCREEN (ACTUAL SIZE). THE WHITE OVALS REPRESENT BRIGHT SPOTS.
Figure 1 shows the distribution of intensity on a screen located away from two slits. The intensity observed is a combination of the diffraction pattern (pattern observed when light encounters an obstacle or opening of a certain width) and the interference due to the fact that light comes from two sources. To determine the distance between two slits, you must find the distance between the middle of the narrow bright fringes on figure 2 . The light used comes from a laser. Using the information from figure 2 a) the distance between the slits and b) the width of each slit (assume the same for both). You can assume that the angles are small.