Home /
Expert Answers /
Advanced Physics /
figure-1-shows-the-state-variable-filter-used-for-band-pass-applications-the-basic-operation-o-pa170
(Solved): Figure 1 shows the state variable filter used for band-pass applications. The basic operation o ...
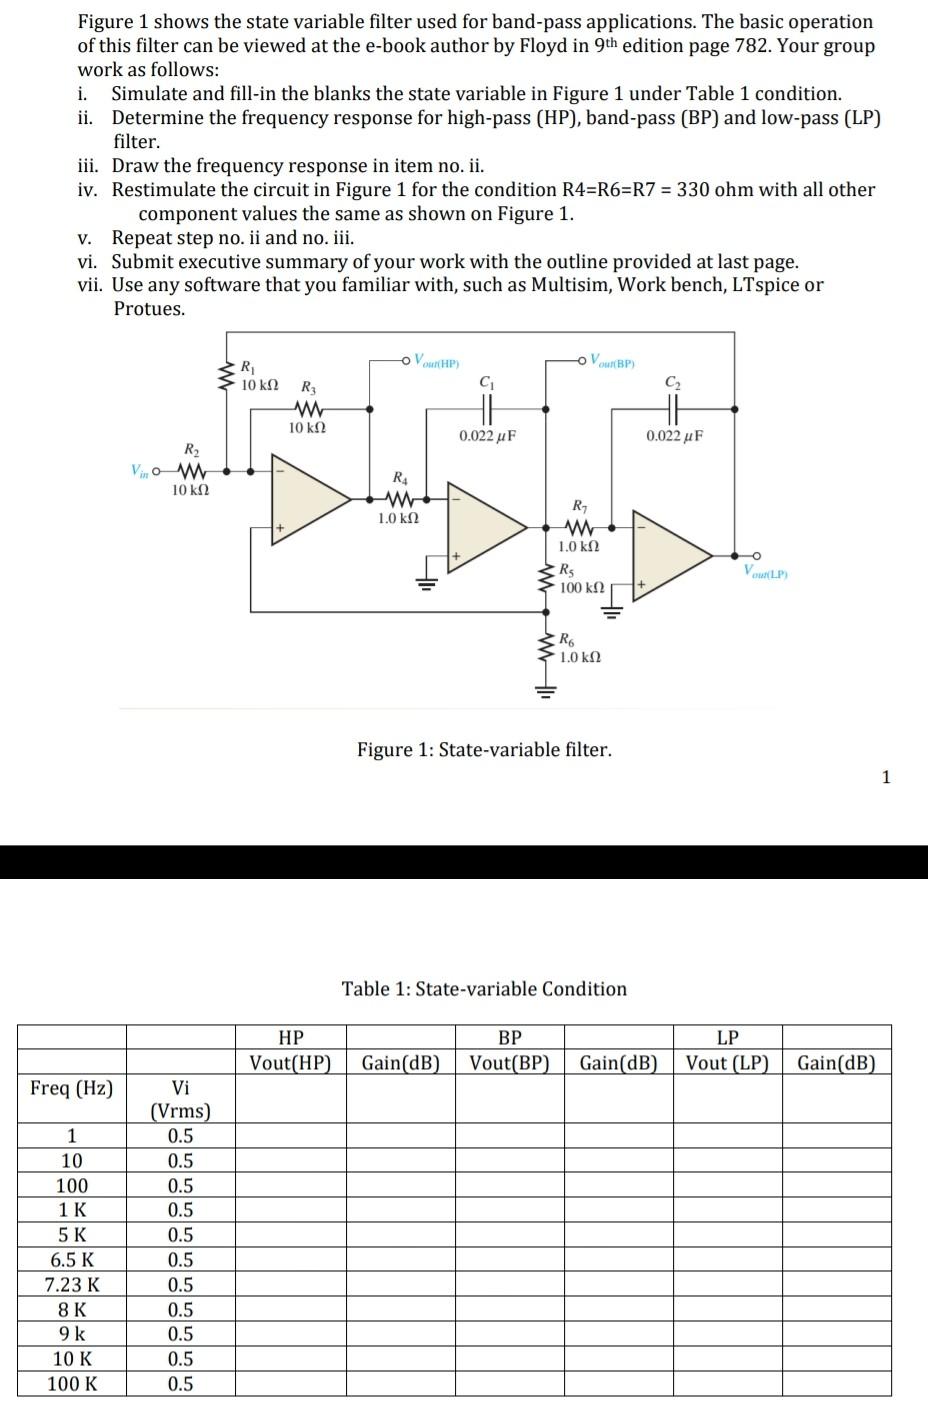
Figure 1 shows the state variable filter used for band-pass applications. The basic operation of this filter can be viewed at the e-book author by Floyd in edition page 782 . Your group work as follows: i. Simulate and fill-in the blanks the state variable in Figure 1 under Table 1 condition. ii. Determine the frequency response for high-pass (HP), band-pass (BP) and low-pass (LP) filter. iii. Draw the frequency response in item no. ii. iv. Restimulate the circuit in Figure 1 for the condition R4=R6=R7 with all other component values the same as shown on Figure 1. v. Repeat step no. ii and no. iii. vi. Submit executive summary of your work with the outline provided at last page. vii. Use any software that you familiar with, such as Multisim, Work bench, LTspice or Protues. Figure 1: State-variable filter. 1 Table 1: State-variable Condition
Expert Answer
The cutoff frequency of the circuit is 300 Hz. Hence, the employing the fol