Home /
Expert Answers /
Electrical Engineering /
figure-3-1-shows-an-rlc-circuit-at-t-0-s-assume-a-current-source-of-5a-is-applied-to-the-circuit-pa285
(Solved): Figure 3.1 shows an RLC circuit at t> 0 s. Assume a current source of 5A is applied to the circuit ...
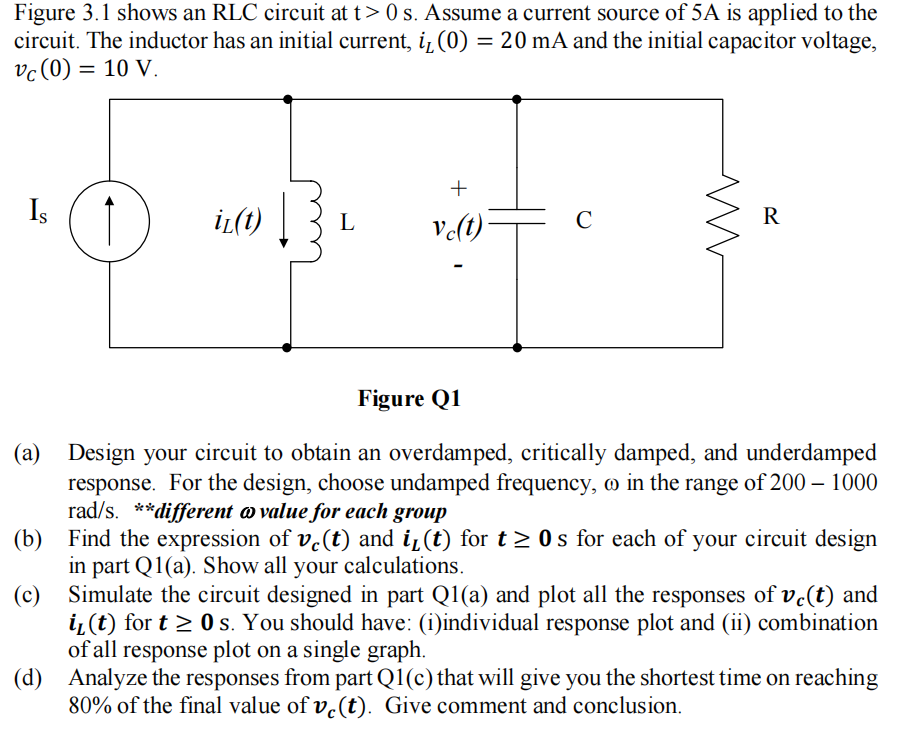
Figure 3.1 shows an RLC circuit at t> 0 s. Assume a current source of 5A is applied to the circuit. The inductor has an initial current, ?? (0) = 20 mA and the initial capacitor voltage, vc (0) = 10 V. + Is O iz(t) | L vc(t) C R Figure Q1 (a) Design your circuit to obtain an overdamped, critically damped, and underdamped response. For the design, choose undamped frequency, o in the range of 200 - 1000 rad/s. **different a value for each group (b) Find the expression of vc(t) and i?(t) for t? 0s for each of your circuit design in part Q1(a). Show all your calculations. (c) Simulate the circuit designed in part Q1(a) and plot all the responses of vc(t) and i(t) for t? 0 s. You should have: (i)individual response plot and (ii) combination of all response plot on a single graph. (d) Analyze the responses from part Q1(c) that will give you the shortest time on reaching 80% of the final value of ve(t). Give comment and conclusion.