Home /
Expert Answers /
Earth Sciences /
figurv-2b-3-is-the-national-map-with-she-centen-of-high-and-low-pressure-systems-fronts-and-weath-pa848
(Solved): Figurv 2B-3 is the national map with she centen of high and low pressure systems, fronts, and weath ...
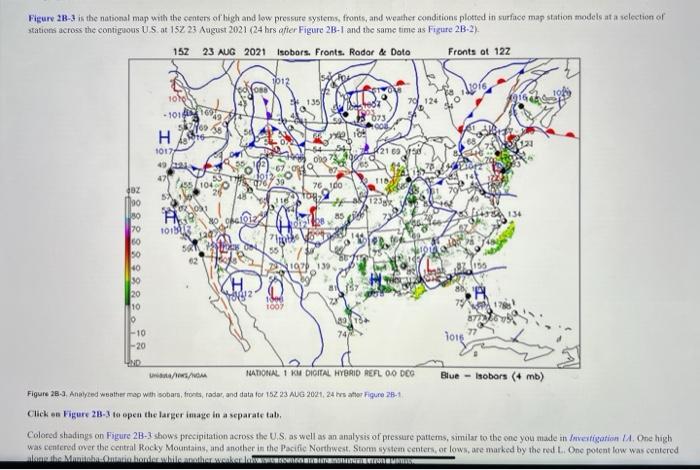
Figurv 2B-3 is the national map with she centen of high and low pressure systems, fronts, and weather conditions plotted in surface map station modele at a selection of stations across the configuous U.S. at 152 23 August 2021 ( 24 hrs affer Fieure 2B-l and the same time as Fieure 2B-2). Click es Figure \( 28-3 \) to speu the larger imaye in a separate tab. Colored shadings on Fogure 2B-3 shows precipiation across the U.S; as well as an analysis of pressure patiems, similar to the che you made in /nvertigation hi. One high Was centerst over the central Rocky Mounains, and another in the Pociffe Northwest. Storm system centens, or lown, are marked by the red L. One potent fow was centered
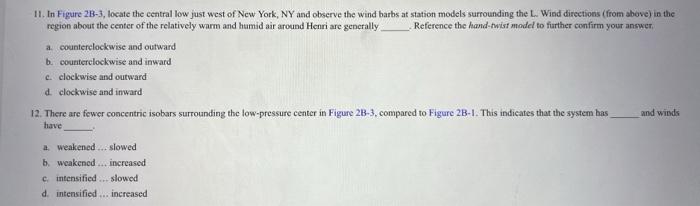
11. In Figure 2B-3, locate the central low just west of New York, NY and observe the wind barbs at station models surrounding the L. Wind directions (from above) in the region about the center of the relatively warm and humid air around Henri are generally. Reference the hand-twist model to further confirm your answer. a. counterclockwise and outward b. counterelockwise and inward c. clockwise and outward d. clockwise and inward 12. There are fewer concentric isobars surrounding the low-pressure center in Figure 2B-3, compared to Figure 2B-1. This indicates that the system has and wists have a. weakened ... slowed b. weakened ... increased c. intensified ... slowed d. intensified ... increased