Home /
Expert Answers /
Statistics and Probability /
find-the-class-width-class-midpoints-of-each-respective-class-and-class-boundaries-and-list-them-pa164
(Solved): Find the class width, class midpoints of each respective class, and class boundaries and list them ...
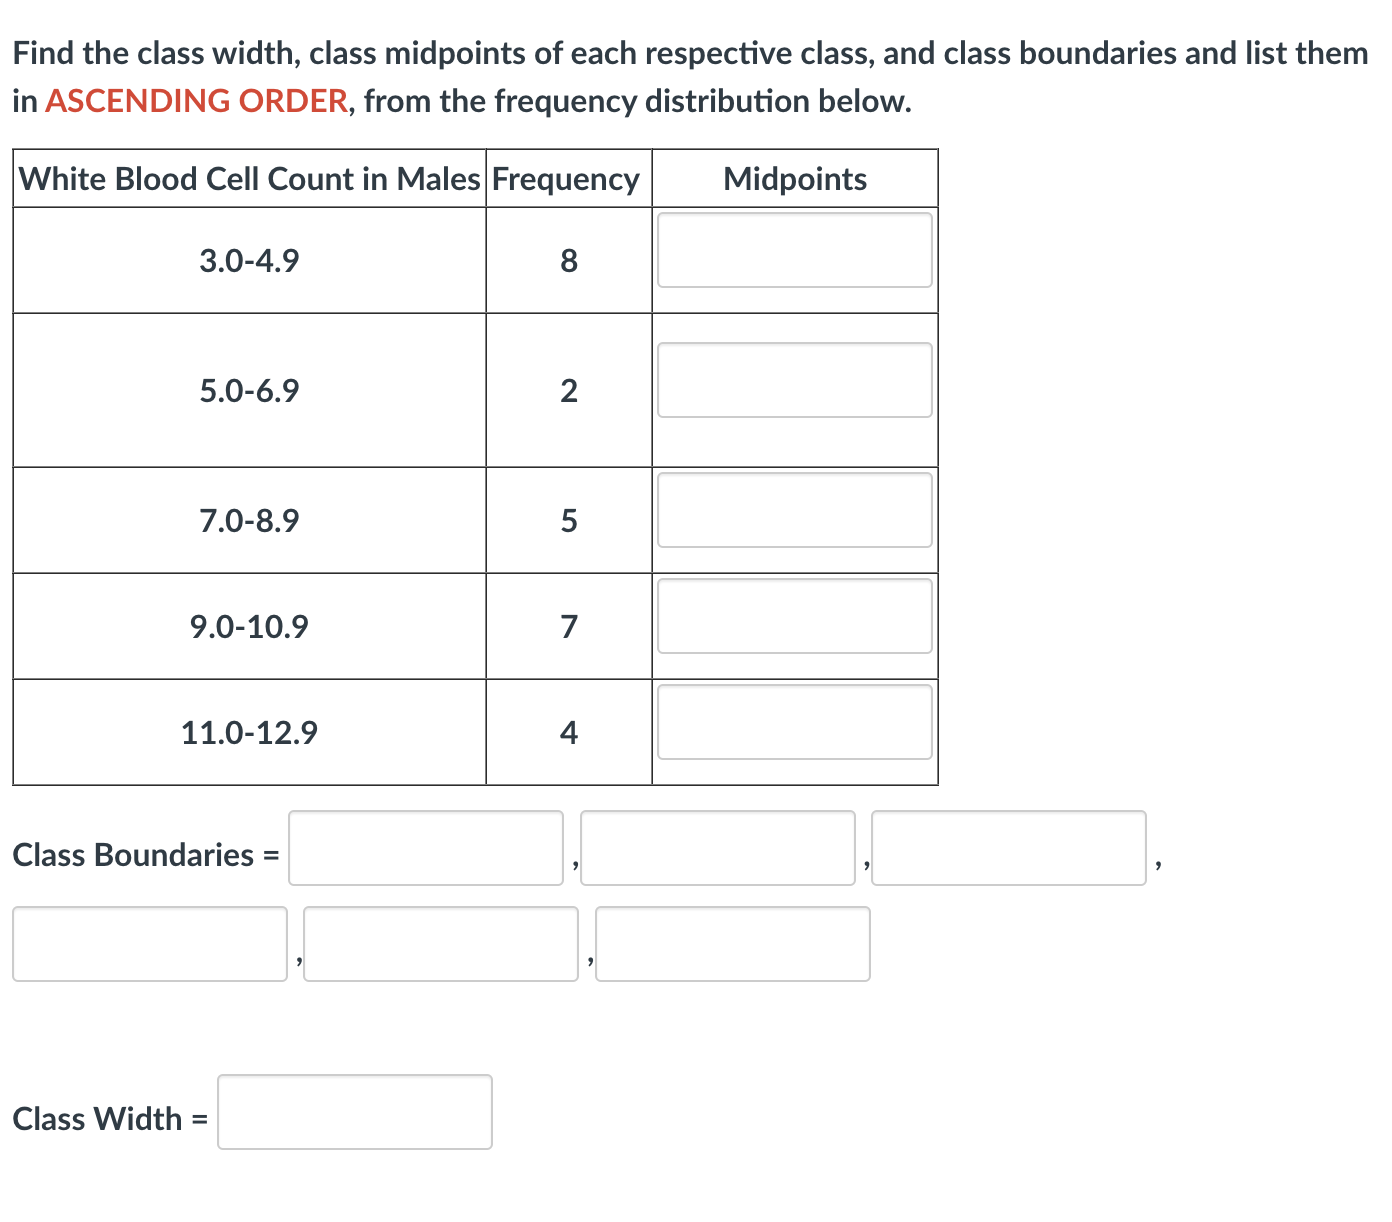
Find the class width, class midpoints of each respective class, and class boundaries and list them in ASCENDING ORDER, from the frequency distribution below.
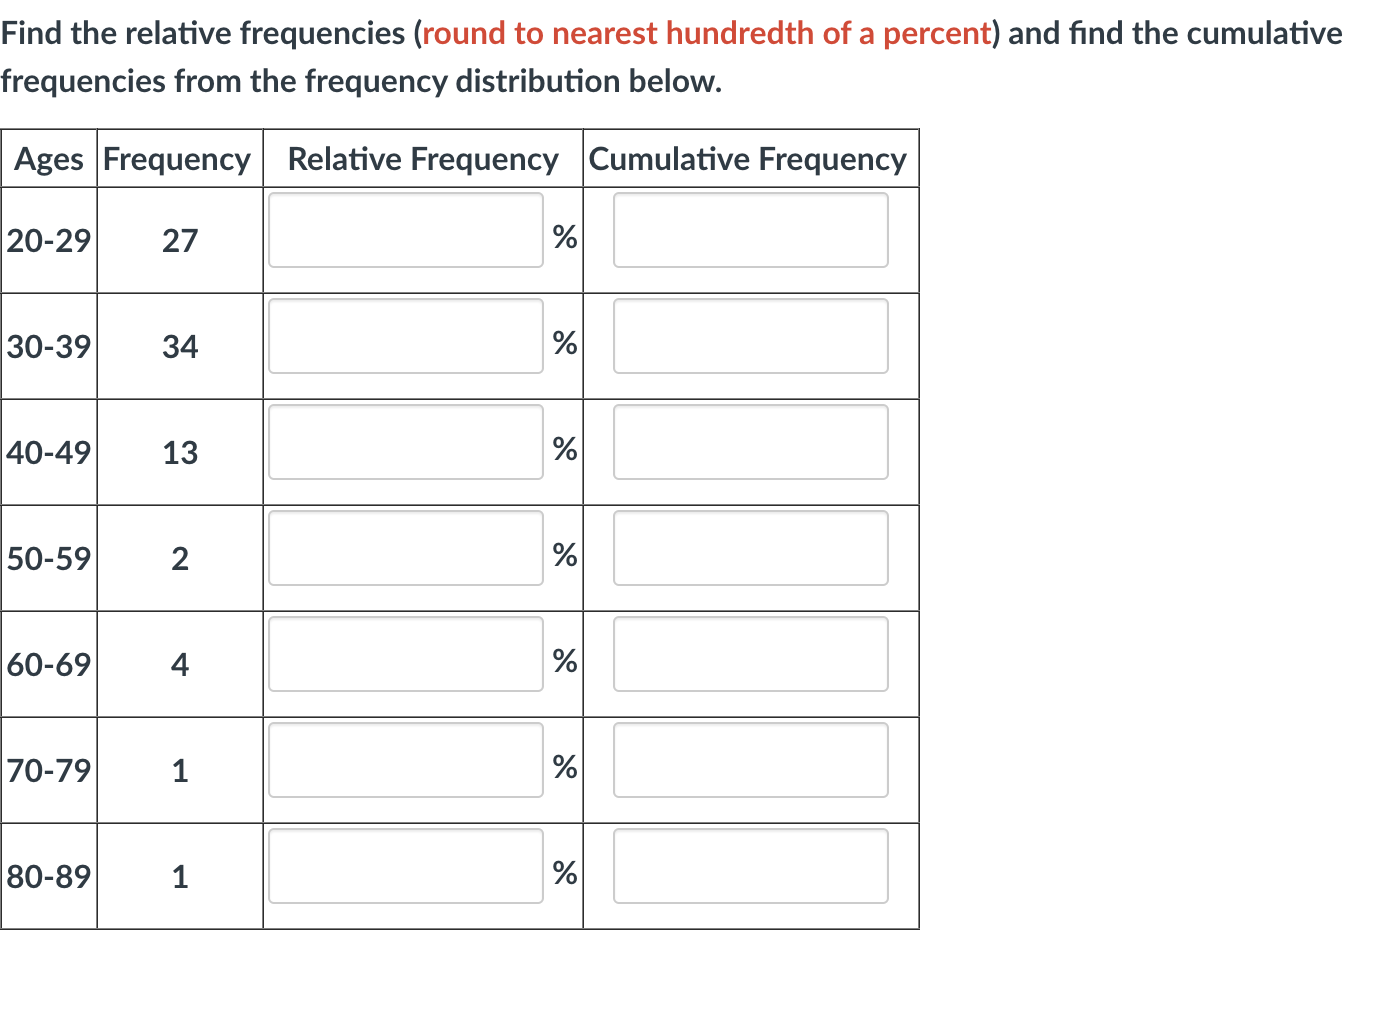
Find the relative frequencies (round to nearest hundredth of a percent) and find the cumulative requencies from the frequency distribution below.
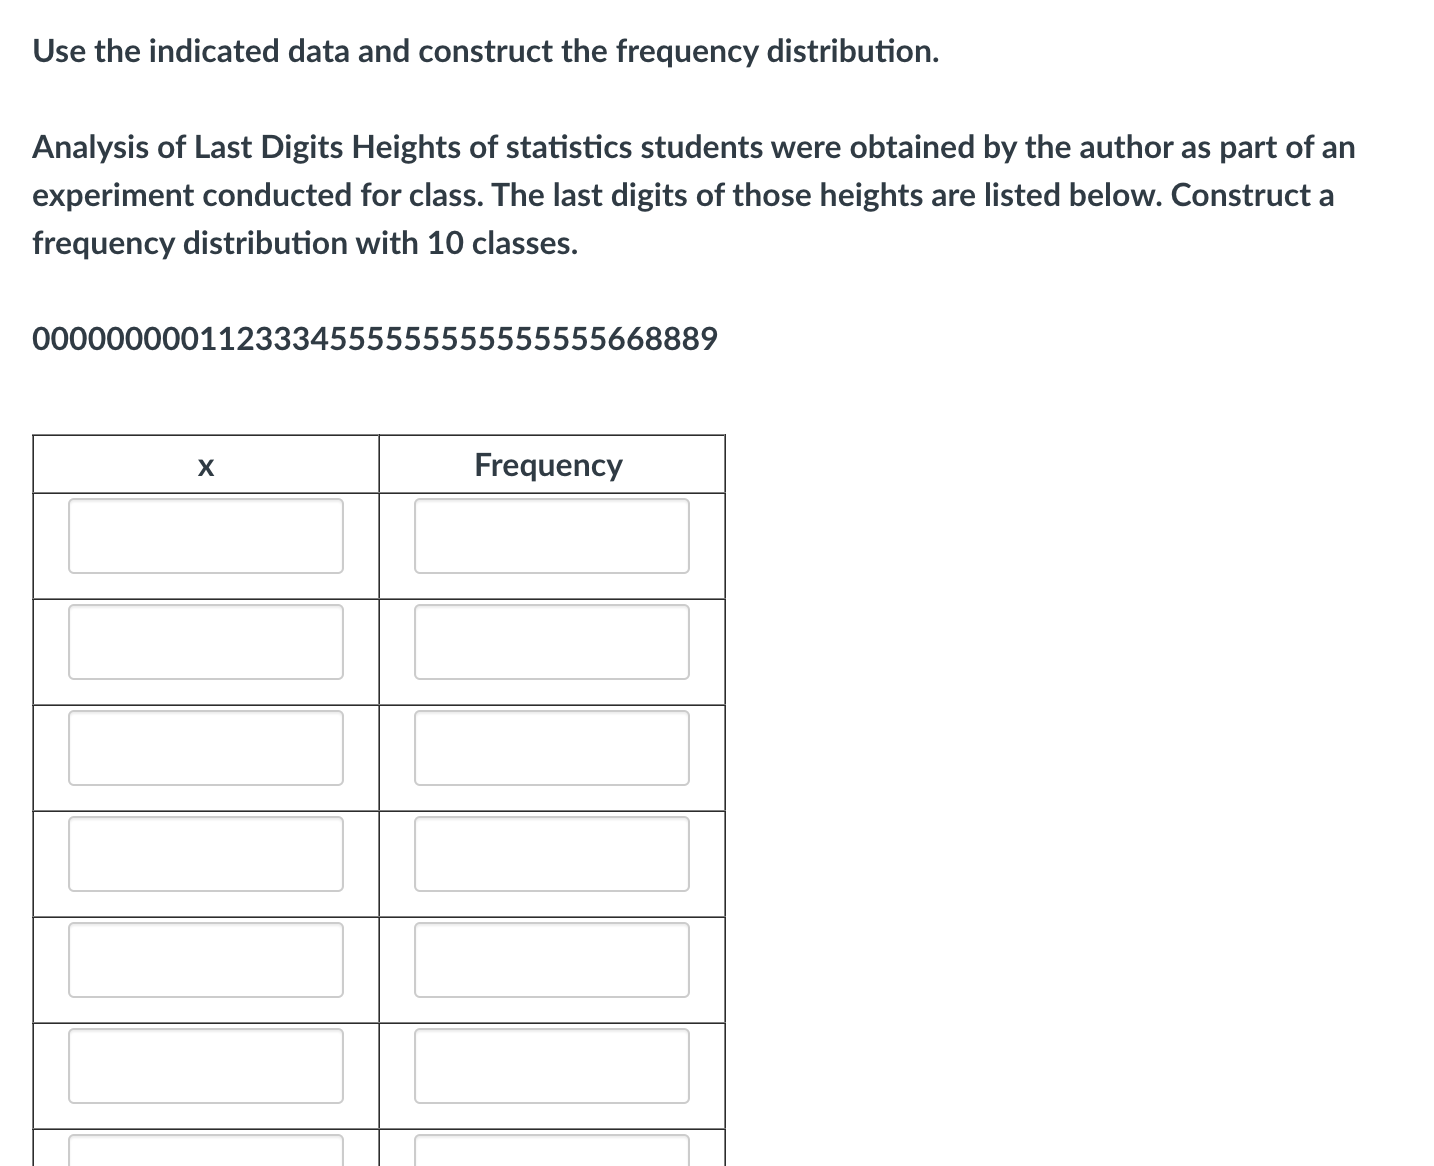
Use the indicated data and construct the frequency distribution. Analysis of Last Digits Heights of statistics students were obtained by the author as part of an experiment conducted for class. The last digits of those heights are listed below. Construct a frequency distribution with 10 classes. 0000000001123334555555555555555668889
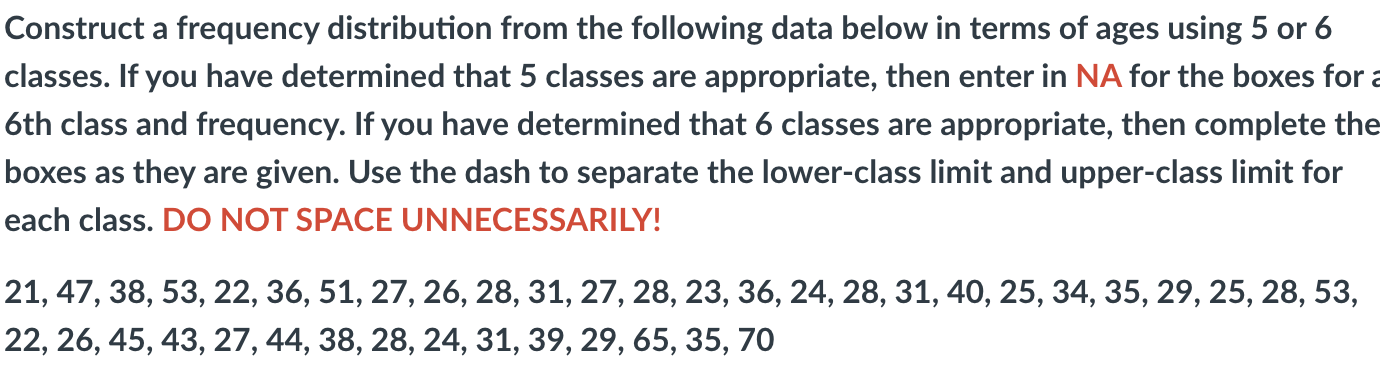
Construct a frequency distribution from the following data below in terms of ages using 5 or 6 classes. If you have determined that 5 classes are appropriate, then enter in NA for the boxes for : 6th class and frequency. If you have determined that 6 classes are appropriate, then complete the boxes as they are given. Use the dash to separate the lower-class limit and upper-class limit for each class. DO NOT SPACE UNNECESSARILY!
Expert Answer
procedure for calculating the midpoints:1. lower class limit + upper class limit2. result in 1 above divided by 2 procedure for calculating the class boundaries:1. subtract the upper-class limit of the first class from the lower-class limit of the second class.2. divide the result in 1 above by 23. subtract the result in 2 above from the lower class limit and add the result in 2 above to the upper class for each classclass width = 2.0class width can be gotten from the difference between the lower limits of two consecutive classes or difference between the upper limit of two consecutive classes.