Home /
Expert Answers /
Statistics and Probability /
find-the-indicated-1q-score-the-graph-to-the-right-depicts-1q-scores-of-adults-and-those-scores-a-pa251
(Solved): Find the indicated 1Q score. The graph to the right depicts 1Q scores of adults, and those scores a ...
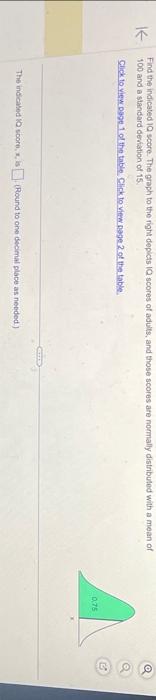
Find the indicated score. The graph to the right depicts scores of adults, and those scores are normally distributed with a mean of 100 and 8 standord derfation of 15 . Click 10 verw osoe 1 of the table, Click to virw page 2 of the table. The indicked to scorti, , is (Round to one decimal place as needed)