Home /
Expert Answers /
Statistics and Probability /
five-observations-taken-for-two-variables-follow-a-which-of-the-following-scatter-diagrams-accura-pa736
(Solved): Five observations taken for two variables follow. a. Which of the following scatter diagrams accura ...
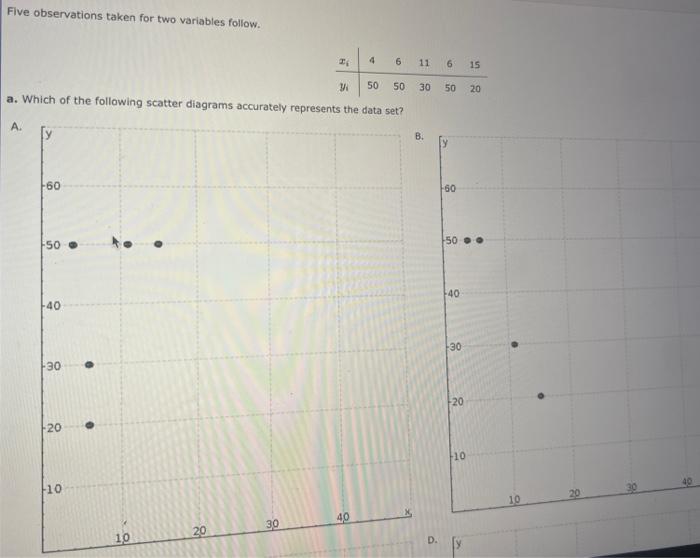
Five observations taken for two variables follow. a. Which of the following scatter diagrams accurately represents the data set?
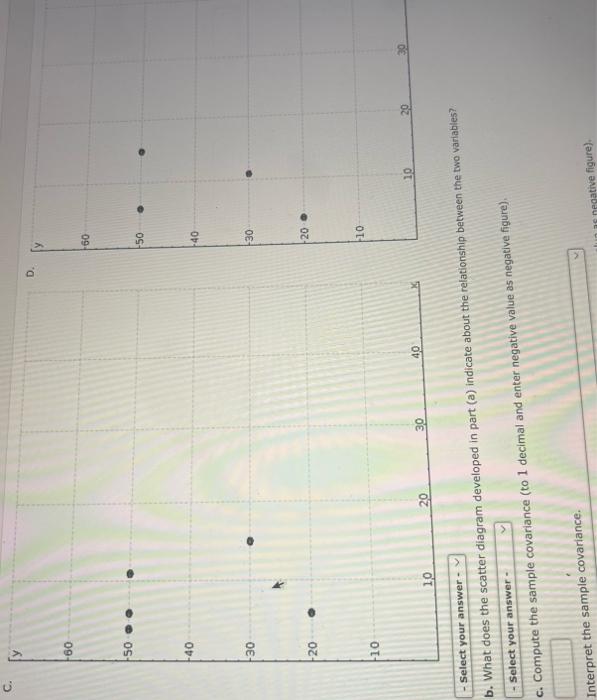
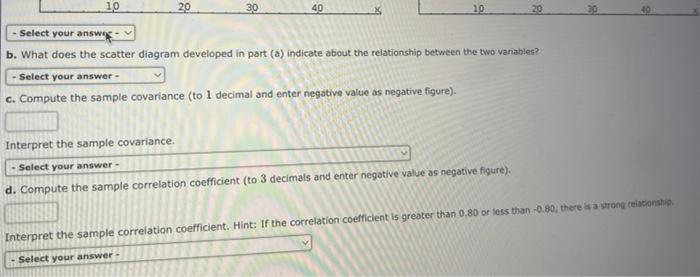
b. What does the scatter diagram developed in part (a) indicate about the relationship between the two variables? c. Compute the sample covariance (to 1 decimal and enter negative value as negative figure), Interpret the sample covariance.
b. What does the scatter diagram developed in part \( (a) \) indicate about the relationship between the two variables? c. Compute the sample covariance (to 1 decimal and enter negative value as negative figure). In rammat tha sample covariance. d. Compute the sample correlation coefficient (to 3 decimals and enter negative vanue as negative figure).
Expert Answer
Here we have to find Nature of scatter diagram of (X,Y) Plotting the points (X,Y)on graph we must obtain scatter diagram. Also find covariance and cor