Home /
Expert Answers /
Statistics and Probability /
for-a-mutiple-linear-regression-analysis-my-scale-location-plot-looks-like-this-and-the-non-constant-pa988
(Solved): for a mutiple linear regression analysis my scale-location plot looks like this and the non constant ...
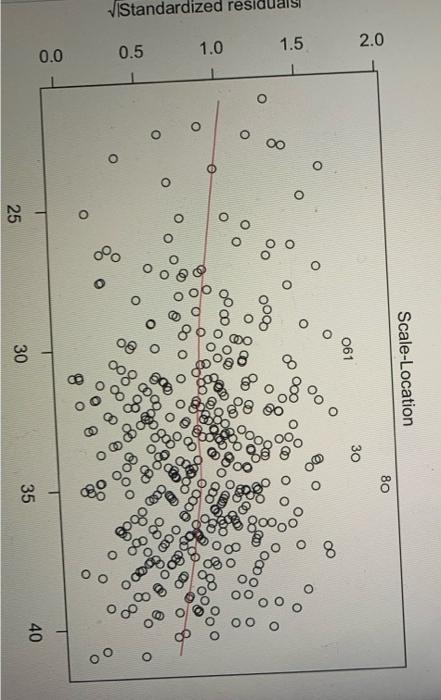
for a mutiple linear regression analysis my scale-location plot looks like this and the non constant error variance test indicated a p value less than .05 (it was .01) so does that mean the assumption for homoscedasticity was violated?