Home /
Expert Answers /
Statistics and Probability /
for-the-data-given-below-answer-parts-a-through-f-a-draw-a-scatter-plot-choose-the-correc-pa604
(Solved): For the data given below, answer parts (a) through (f). (a) Draw a scatter plot. Choose the correc ...
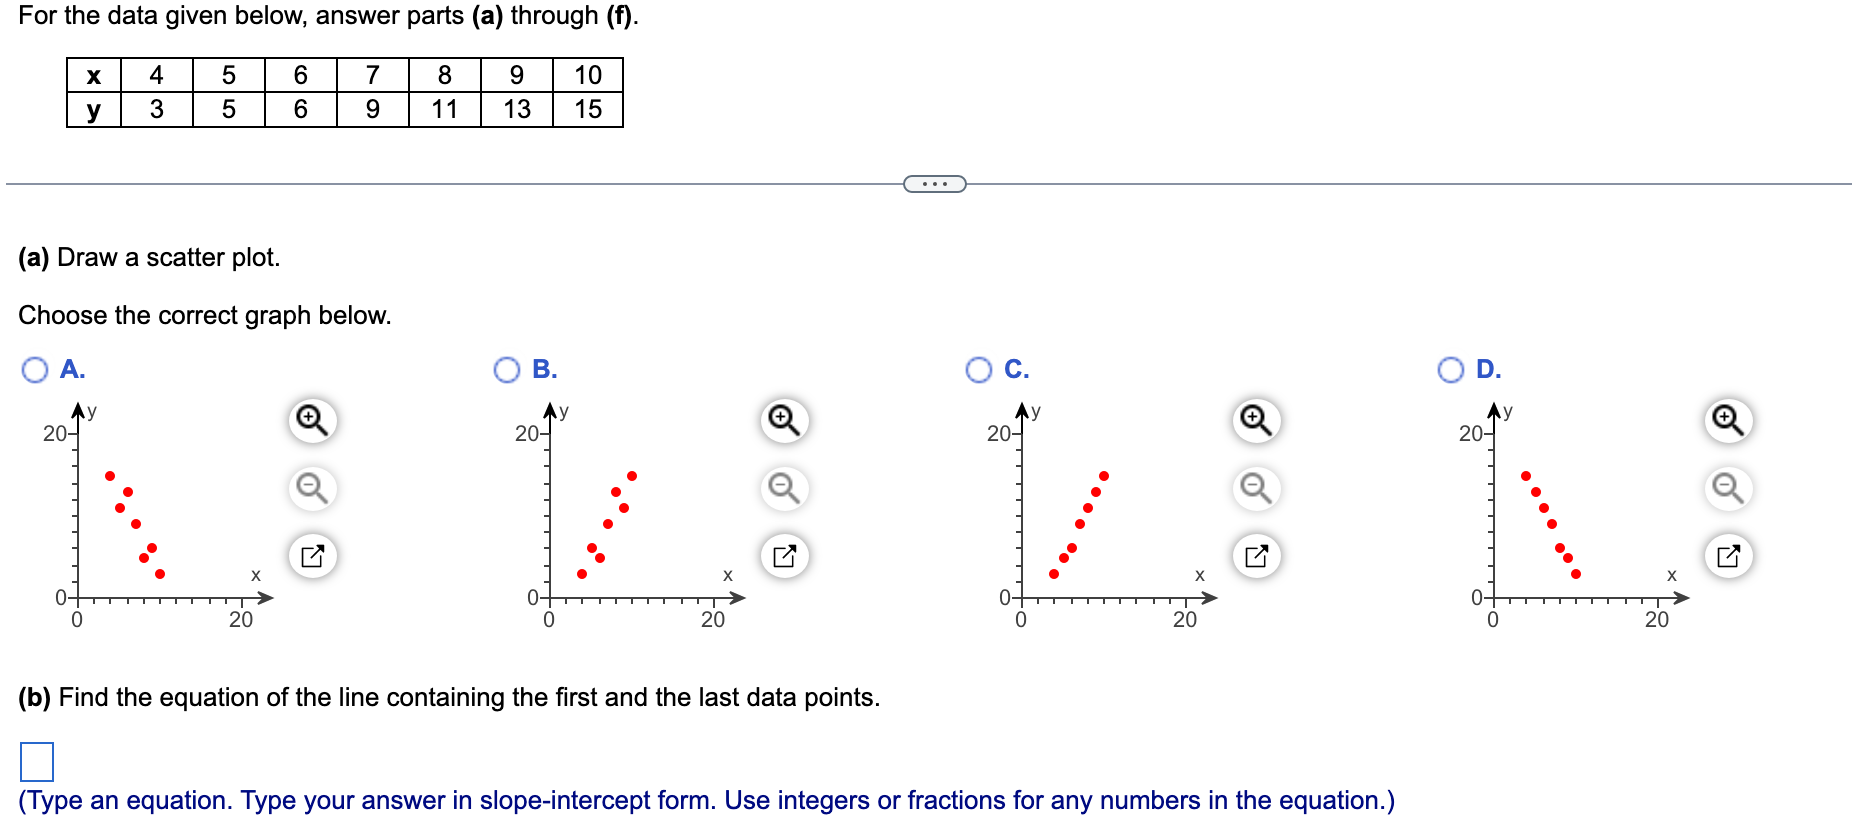
For the data given below, answer parts (a) through (f). (a) Draw a scatter plot. Choose the correct graph below. A. B. C. D. (b) Find the equation of the line containing the first and the last data points. (Type an equation. Type your answer in slope-intercept form. Use integers or fractions for any numbers in the equation.)
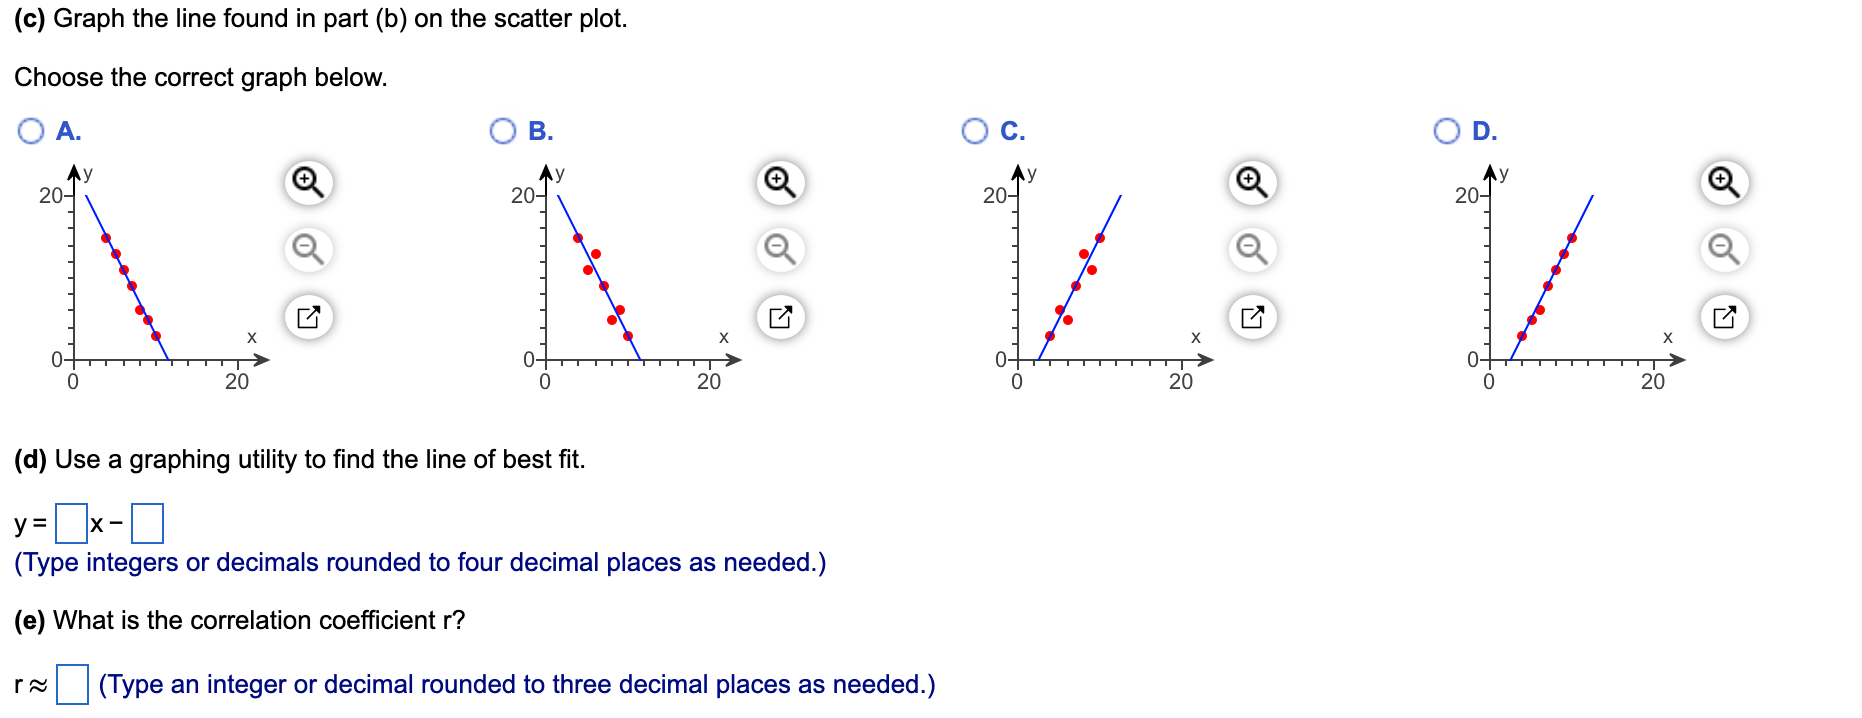
(c) Graph the line found in part (b) on the scatter plot. Choose the correct graph below. A. B. C. D. (d) Use a graphing utility to find the line of best fit. (Type integers or decimals rounded to four decimal places as needed.) (e) What is the correlation coefficient ? (Type an integer or decimal rounded to three decimal places as needed.)
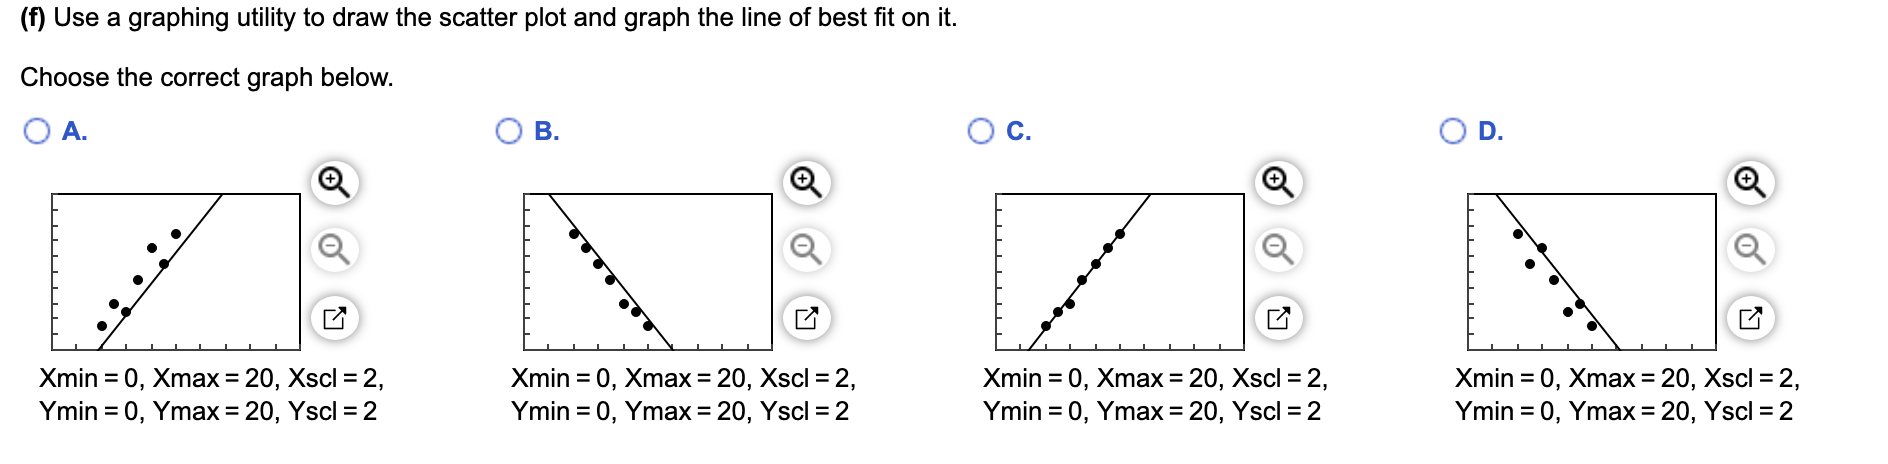
(f) Use a graphing utility to draw the scatter plot and graph the line of best fit on it. Choose the correct graph below. A. B. C. D.
Expert Answer
The given data set is-x = 4,5,6,7,8,9,10y = 3,5