Home /
Expert Answers /
Statistics and Probability /
for-the-following-scores-drag-blue-round-points-onto-the-following-graph-to-sketch-a-scatter-plot-pa491
(Solved): For the following scores, Drag blue round points onto the following graph to sketch a scatter plot ...
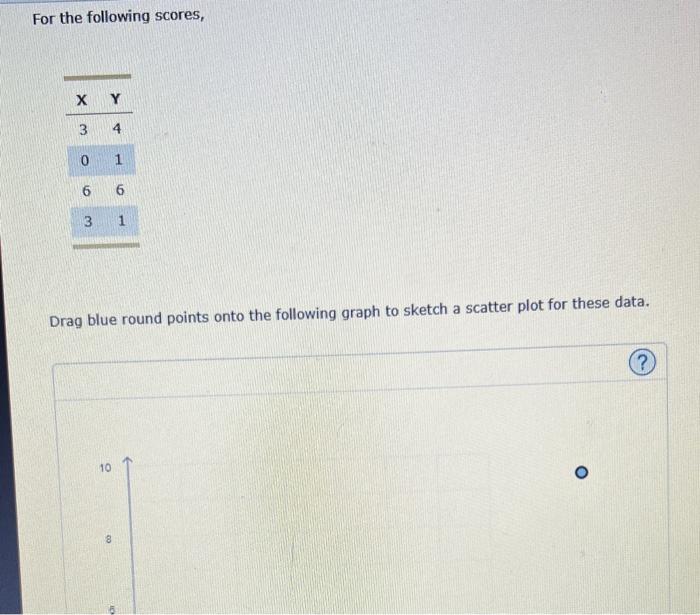
For the following scores, Drag blue round points onto the following graph to sketch a scatter plot for these data.
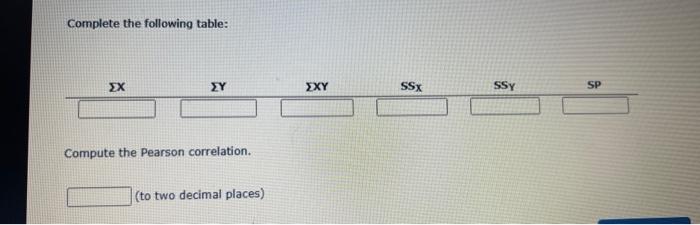
Complete the following table: Compute the Pearson correlation. (to two decimal places)
Expert Answer
Sigma X=Sum of observations in x=3+0+6+3=12 Sigma Y =Sum of observat