Home /
Expert Answers /
Calculus /
given-the-graph-of-f-39-x-sketch-f-x-with-local-extrema-labeled-draw-a-sign-chart-find-the-int-pa773
(Solved): Given the graph of f^(')(x), sketch f(x) with local extrema labeled. Draw a sign chart. Find the int ...
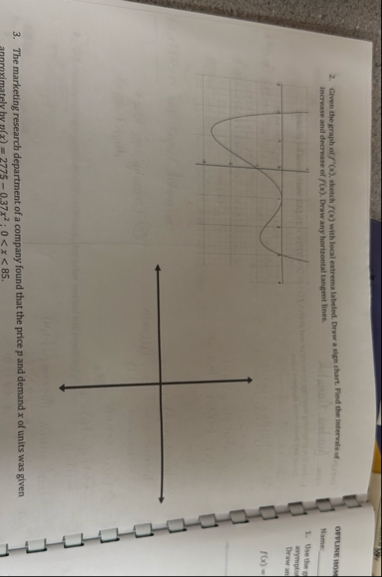
Given the graph of
f^(')(x), sketch
f(x)with local extrema labeled. Draw a sign chart. Find the intervals of Increase and decrease of
f(x). Draw any horizontal tangent lines. The marketing research department of a company found that the price
pand demand
xof units was given annroximately hv
n(x)=2775-0.37x^(2);0.