Home /
Expert Answers /
Economics /
given-the-indicated-maturities-listed-in-the-following-table-assume-the-following-yields-for-us-tre-pa783
(Solved): Given the indicated maturities listed in the following table, assume the following yields for US Tre ...
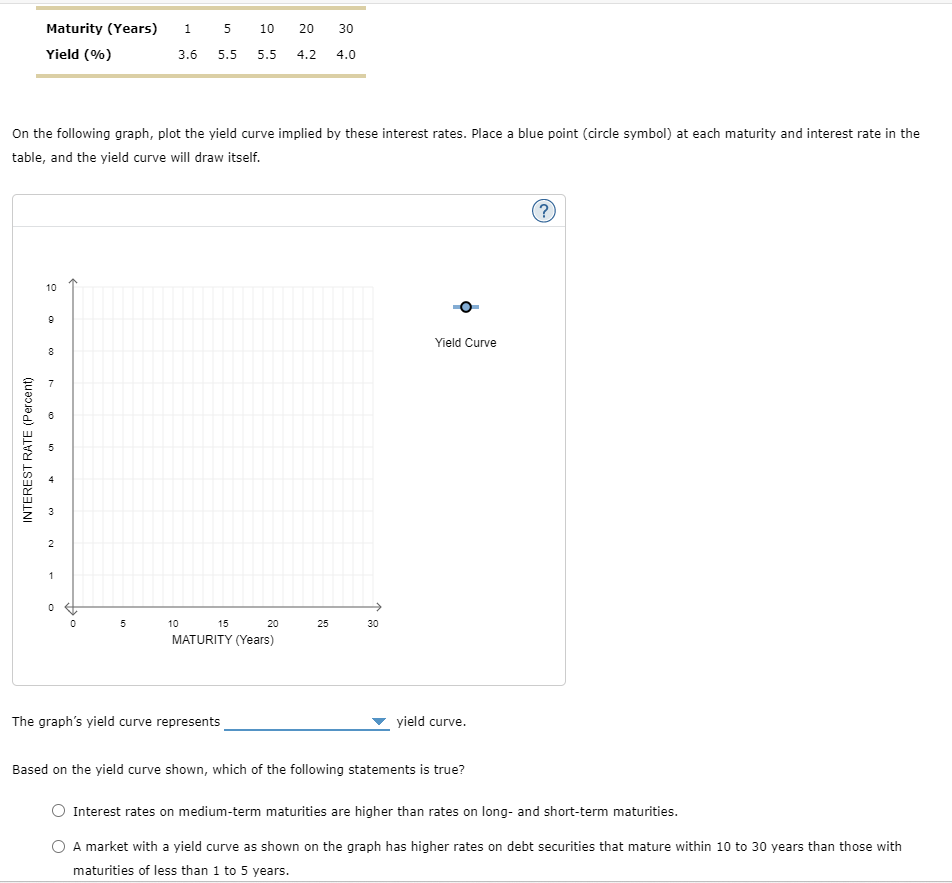
Given the indicated maturities listed in the following table, assume the following yields for US Treasury securities:
On the following graph, plot the yield curve implied by these interest rates. Place a blue point (circle symbol) at each maturity and interest rate in the table, and the yield curve will draw itself. The graph's yield curve represents yield curve. Based on the yield curve shown, which of the following statements is true? Interest rates on medium-term maturities are higher than rates on long-and short-term maturities. A market with a yield curve as shown on the graph has higher rates on debt securities that mature within 10 to 30 years than those with maturities of less than 1 to 5 years.
