Home /
Expert Answers /
Economics /
graph-neeeds-to-be-graphed-wt-a-3-point-curve-line-tool-nbsp-consider-two-countries-home-and-for-pa506
(Solved): *Graph neeeds to be graphed wt a 3-point curve line tool. Consider two countries (Home and For ...
*Graph neeeds to be graphed wt a 3-point curve line tool.
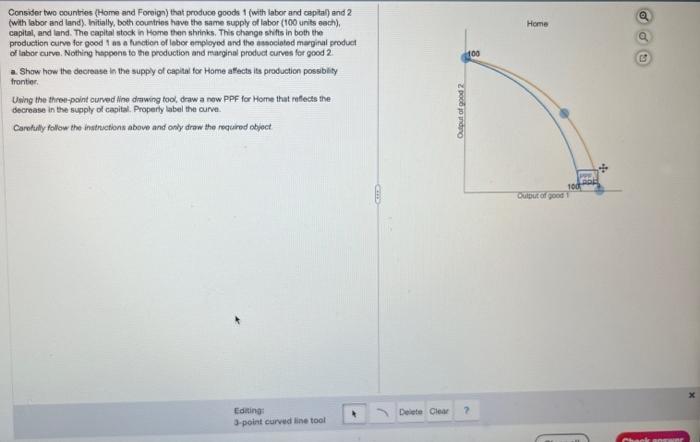
Consider two countries (Home and Foreign) that produce goods 1 (with labor and capital) and 2 (with labor and land), hitially, both countries have the same supply of labor (100 units 0ach), capital, and land. The capital stock in Home then shrinks. This change shifts in both the production airvo for good 1 as a functien of leber employed and the associated marginal product of tabor curve. Nothing happens to the production and marginal product curves fer good \( 2 . \) a. Shaw how the decrease in the supply of eapita for Home afects its production possblity fronter, Using the throe-point ourved fine drawing foo, draw a now PPF for Horne that reflects the decrease in the supply of casital. Property labal the curve. Comptily follow the inserefions above and osly draw the requred object
Expert Answer
Production possibility curve (PPC) PPC curve shows the combin