Home /
Expert Answers /
Physics /
graphical-analysis-the-graph-in-the-figure-represents-the-velocity-of-a-particle-as-it-travels-al-pa435
(Solved): Graphical Analysis: The graph in the figure represents the velocity of a particle as it travels al ...
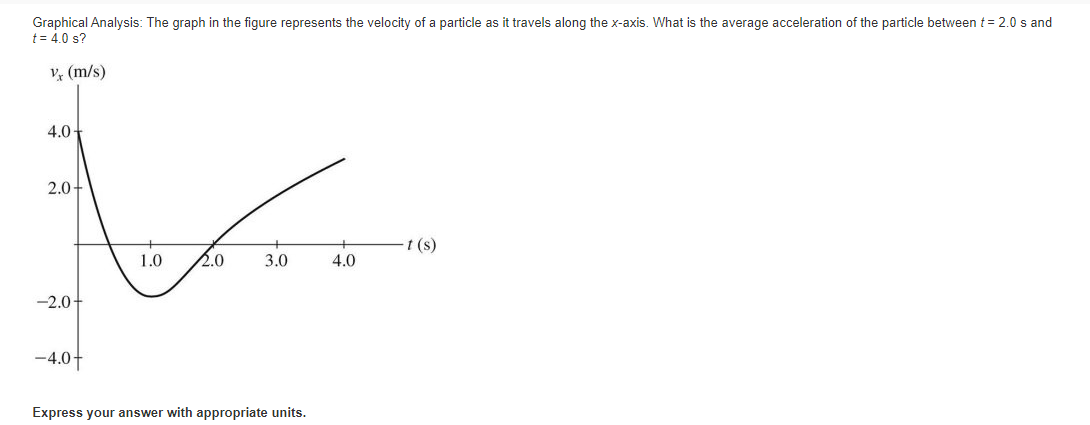
Graphical Analysis: The graph in the figure represents the velocity of a particle as it travels along the x-axis. What is the average acceleration of the particle between t = 2.0 s and t = 4.0 s? Vx (m/s) 4.0- 2.0+ t (s) 1.0 2.0 3.0 4.0 -2.0- -4.0+ Express your answer with appropriate units.
