Home /
Expert Answers /
Statistics and Probability /
hch-industries-has-decided-to-use-a-p-chart-with-2-sigma-control-limits-to-monitor-the-proportion-pa577
(Solved): HCH Industries has decided to use a p-Chart with 2-sigma control limits to monitor the proportion ...
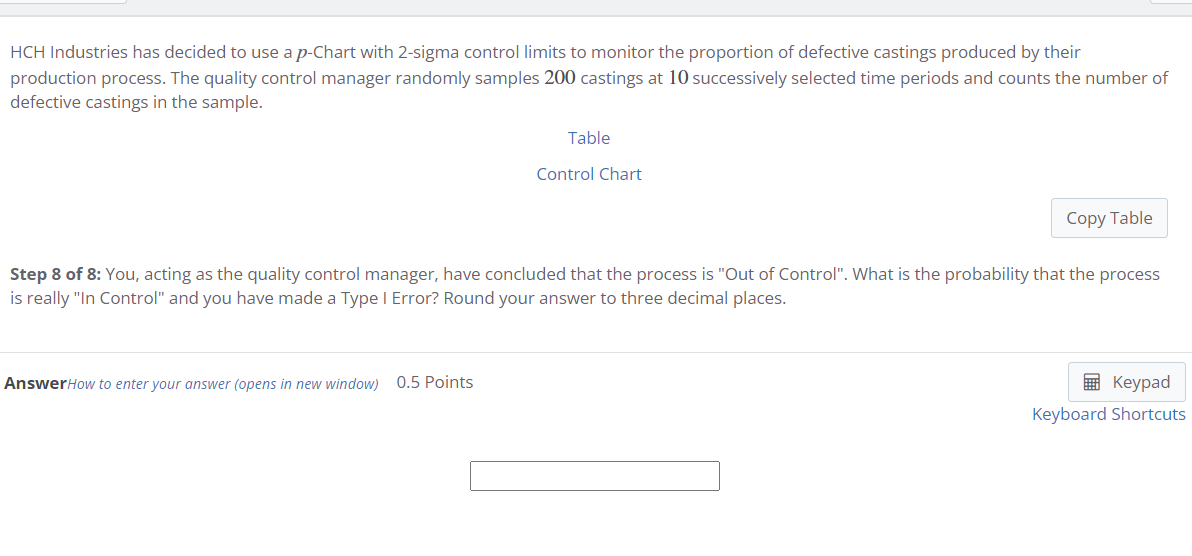

Industries has decided to use a p-Chart with 2-sigma control limits to monitor the proportion of defective castings produced by their production process. The quality control manager randomly samples 200 castings at 10 successively selected time periods and counts the number of defective castings in the sample. Table Control Chart Step 8 of 8: You, acting as the quality control manager, have concluded that the process is "Out of Control". What is the probability that the process is really "In Control" and you have made a Type I Error? Round your answer to three decimal places.
Industries has decided to use a p-Chart with 2-sigma control limits to monitor the proportion of defective castings produced by their production process. The quality control manager randomly samples 200 castings at 10 successively selected time periods and counts the number of defective castings in the sample. Table Control Chart Step 6 of 8: At the next time period, 200 castings are sampled and 25 defective castings are detected.
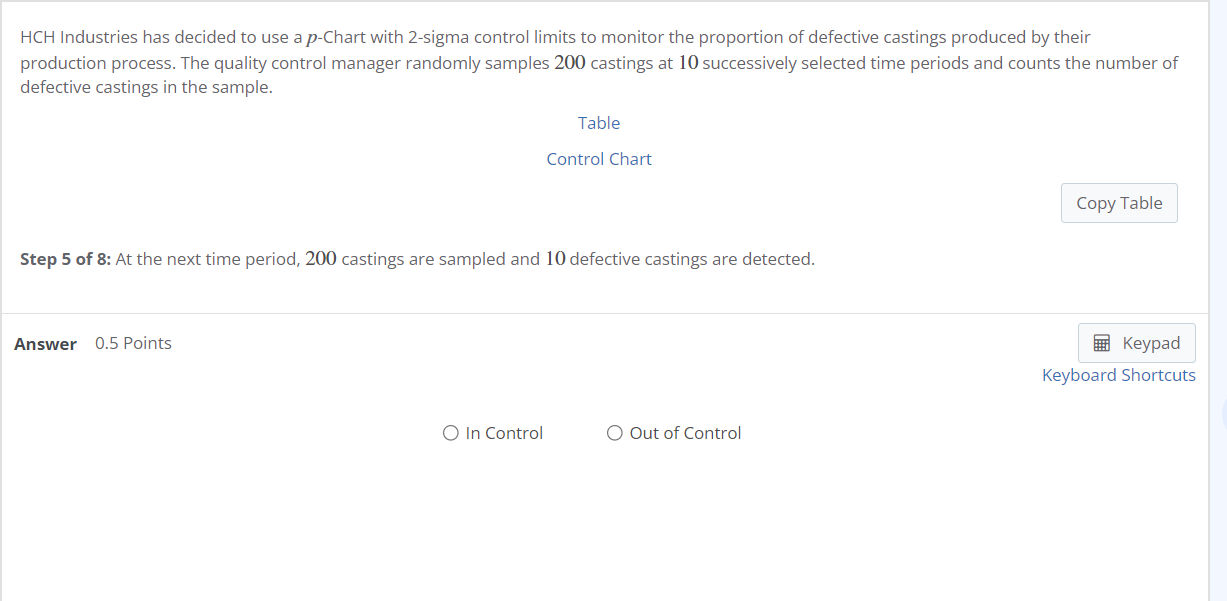
Industries has decided to use a p-Chart with 2-sigma control limits to monitor the proportion of defective castings produced by their production process. The quality control manager randomly samples 200 castings at 10 successively selected time periods and counts the number of defective castings in the sample. Table Control Chart Step 5 of 8: At the next time period, 200 castings are sampled and 10 defective castings are detected.
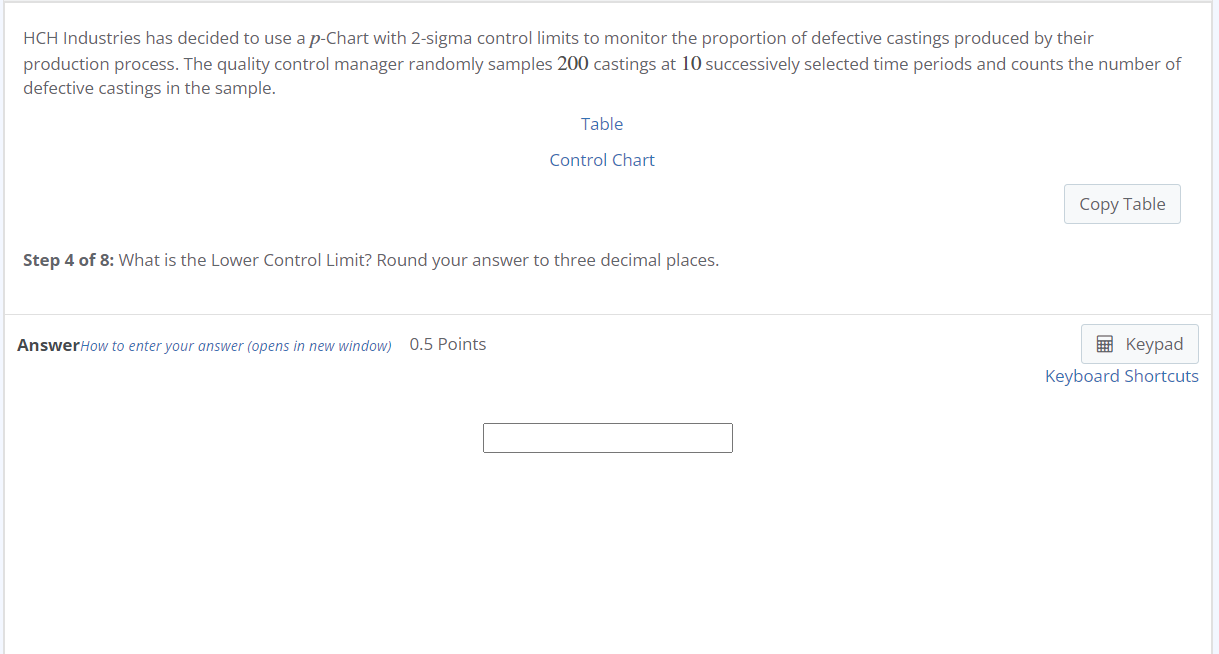
Industries has decided to use a -Chart with 2-sigma control limits to monitor the proportion of defective castings produced by their production process. The quality control manager randomly samples 200 castings at 10 successively selected time periods and counts the number of defective castings in the sample. Table Control Chart Step 4 of 8: What is the Lower Control Limit? Round your answer to three decimal places.
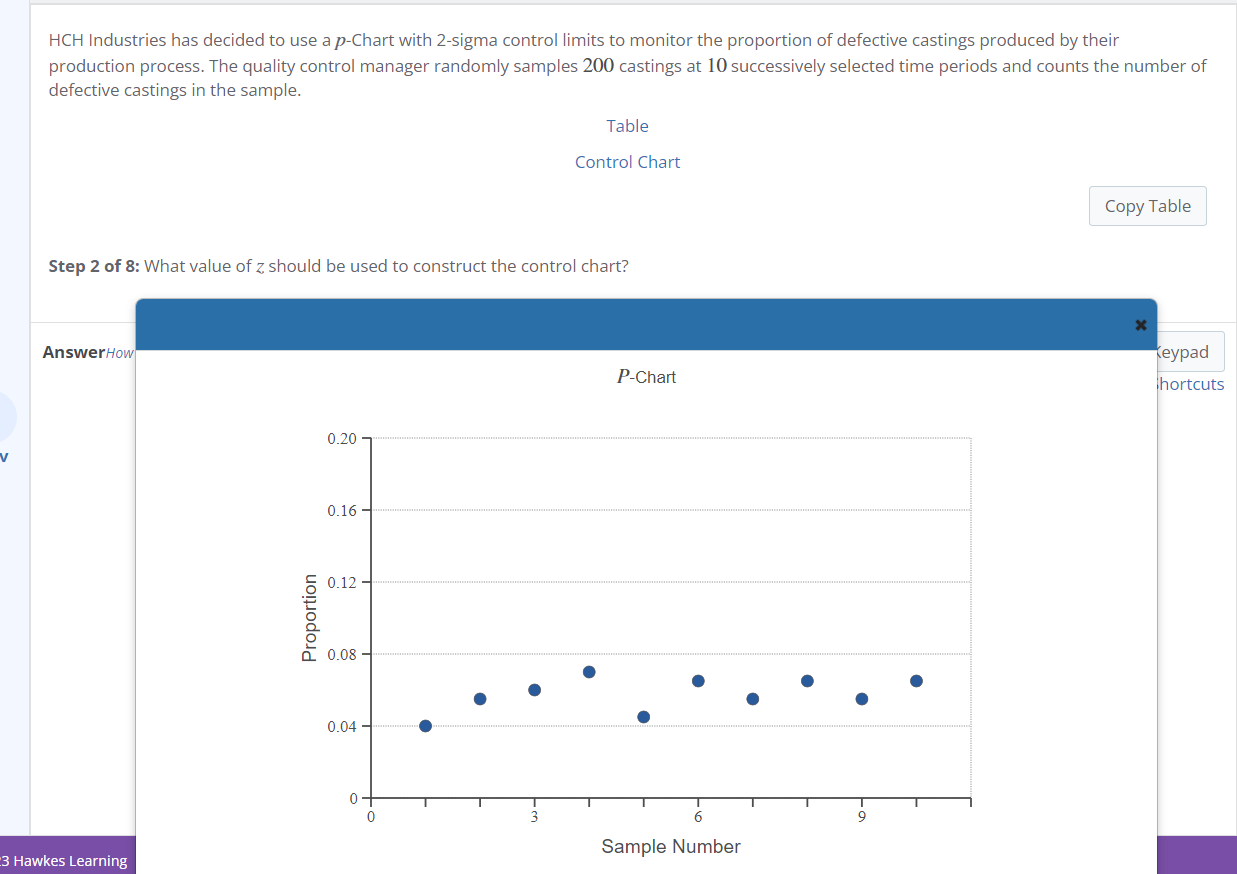
Industries has decided to use a p-Chart with 2-sigma control limits to monitor the proportion of defective castings produced by their production process. The quality control manager randomly samples 200 castings at 10 successively selected time periods and counts the number of defective castings in the sample. Table Control Chart Step 2 of 8: What value of should be used to construct the control chart? 3 Hawkes Learning
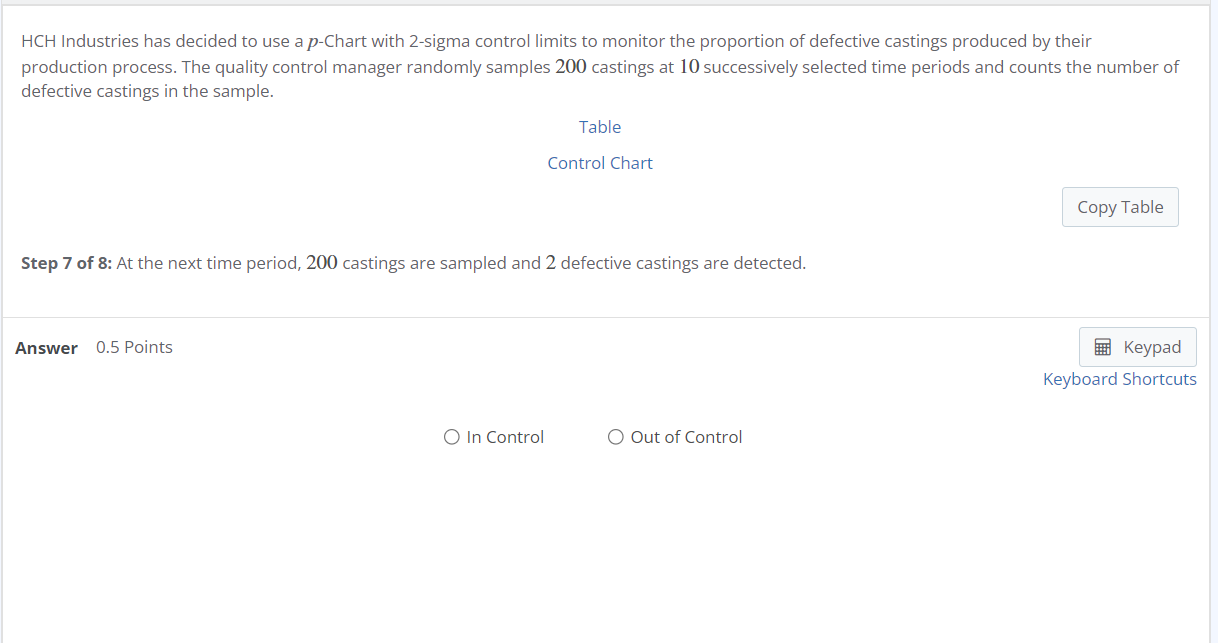
Industries has decided to use a p-Chart with 2-sigma control limits to monitor the proportion of defective castings produced by their production process. The quality control manager randomly samples 200 castings at 10 successively selected time periods and counts the number of defective castings in the sample. Table Control Chart Step 7 of 8: At the next time period, 200 castings are sampled and 2 defective castings are detected.
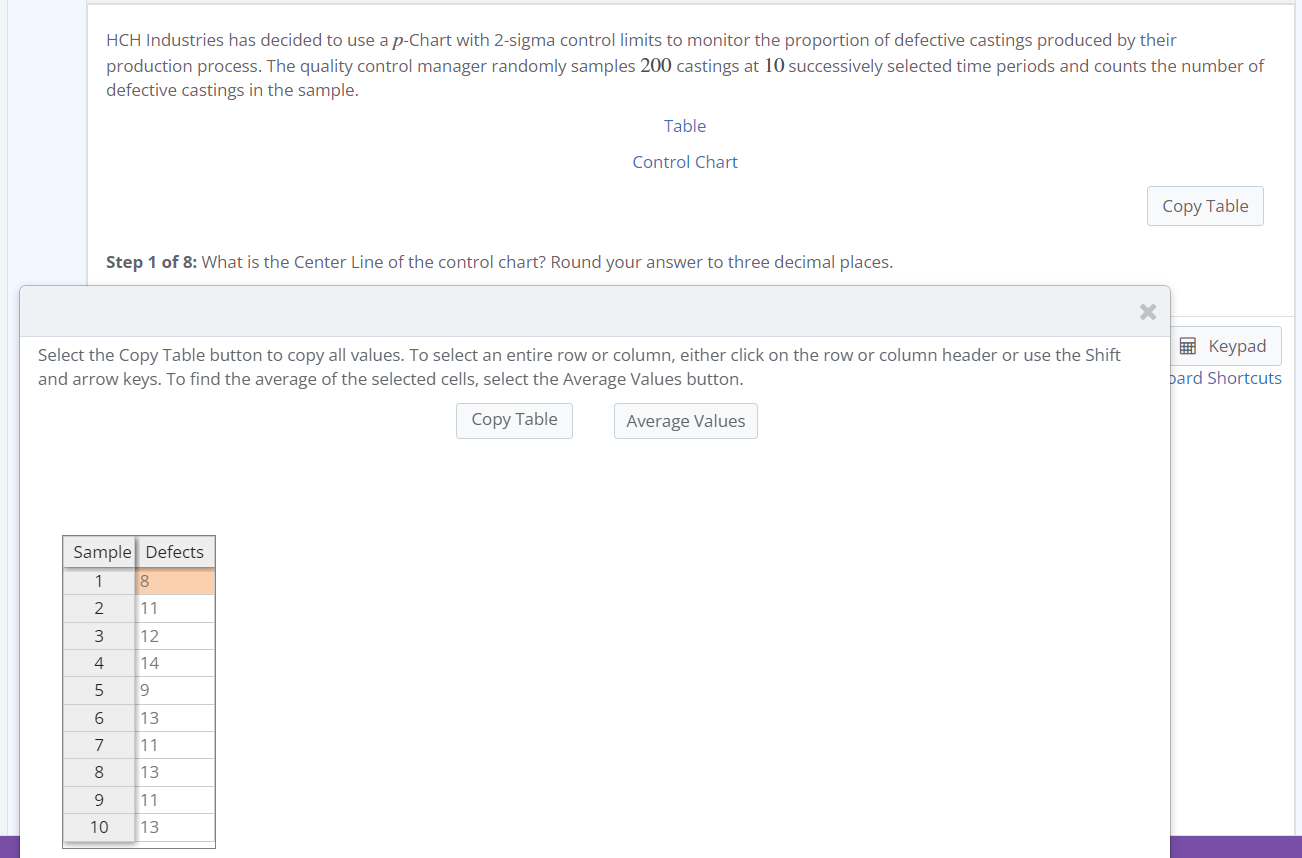
Industries has decided to use a p-Chart with 2-sigma control limits to monitor the proportion of defective castings produced by their production process. The quality control manager randomly samples 200 castings at 10 successively selected time periods and counts the number of defective castings in the sample. Table Control Chart Step 1 of 8: What is the Center Line of the control chart? Round your answer to three decimal places. ct the Copy Table button to copy all values. To select an entire row or column, either click on the row or column header or use the Shift arrow keys. To find the average of the selected cells, select the Average Values button. pard Shortcuts