Home /
Expert Answers /
Civil Engineering /
help-please-with-steps-nbsp-1-discuss-the-difference-between-vector-and-raster-data-formats-for-pa148
(Solved): Help please , with steps 1) Discuss the difference between vector and raster data formats for ...
Help please , with steps
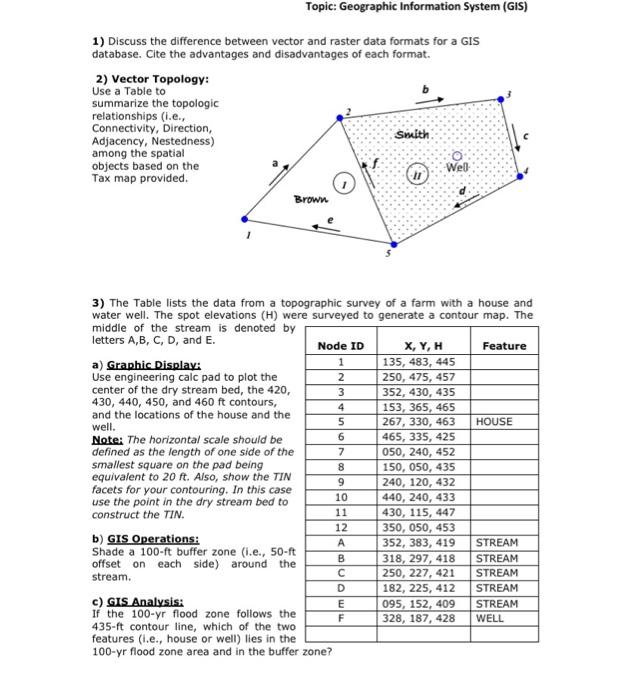
1) Discuss the difference between vector and raster data formats for a GIS database. Cite the advantages and disadvantages of each format. 2) Vector Topology: Use a Table to summarize the topologic relationships (i.e., Connectivity, Direction, Adjacency, Nestedness) among the spatial objects based on the Tax map provided. 3) The Table lists the data from a topographic survey of a farm with a house and water well. The spot elevations \( (\mathrm{H}) \) were surveyed to generate a contour map. The middle of the stream is denoted by letters \( A, B, C, D \), and \( E \). a) Graphic Display: Use engineering calc pad to plot the center of the dry stream bed, the 420 , \( 430,440,450 \), and \( 460 \mathrm{ft} \) contours, and the locations of the house and the well. Note: The horizontal scale should be defined as the length of one side of the smallest square on the pad being equivalent to \( 20 \mathrm{ft} \). Also, show the TIN facets for your contouring. In this case use the point in the dry stream bed to construct the TIN. b) GIS Operations: Shade a 100-ft buffer zone (i.e., 50-ft offset on each side) around the stream. c) GIS Analysis: If the \( 100-y r \) flood zone follows the 435-ft contour line, which of the two features (i.e., house or well) lies in the \( 100-y r \) flood zone area and in the buffer
Expert Answer
(1) Vector Spatial Data Vector data is not made up of a grid of pixels. Instead, vector graphics are comprised of vertices and paths. The three basic