Home /
Expert Answers /
Economics /
help-pls-the-graph-below-depicts-an-economy-where-an-increase-in-aggregate-demand-has-caused-inflat-pa989
(Solved): help pls! The graph below depicts an economy where an increase in aggregate demand has caused inflat ...
help pls!
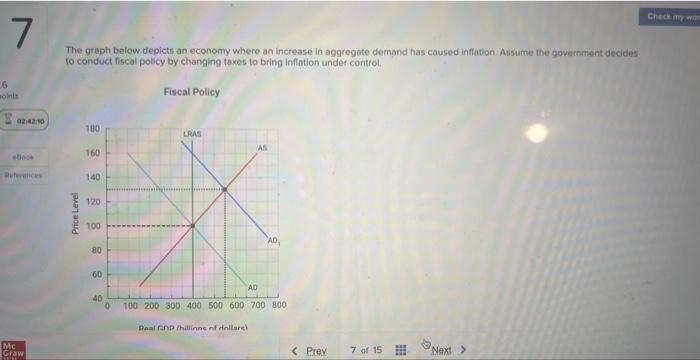
The graph below depicts an economy where an increase in aggregate demand has caused inflation. Assume the government decides to conduct fiscal policy by changing takes to bring inflation under control.
Instructions: Enter your answer as a whole number. If you are entering a negative number include a minus sigr. a. How much does aggregate demand need to change to restore the economy to its long-run equillbrium?? billion b. If the MPC is \( 0.75 \), how much do taxes need to change to shift aggreghte demand by the amount you found in part a? billion Suppose instead that the MPC is \( 0.6 \). c. How much does aggregate demand and taxes need to change to restore the economy to its long-run equilibrium? Aggregate demand needs to change by \( \$ \) billion and taxes need to change by \( \$ \)
Expert Answer
a) To restore the economy to it's long-run equilibrium = Difference between AD1 & AD at price $100 = 550 - 400 = $150 billion b) MPC = 0.7 5 Change in