Home /
Expert Answers /
Statistics and Probability /
here-is-a-bivariate-data-set-this-data-can-be-downloaded-as-a-csv-file-with-this-link-download-pa434
(Solved): Here is a bivariate data set. This data can be downloaded as a *.csv file with this link: Download ...
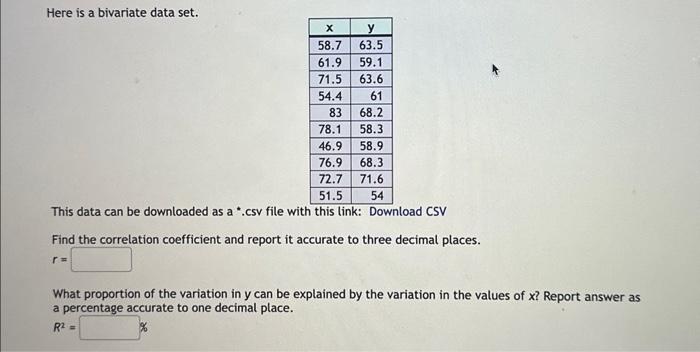
Here is a bivariate data set. This data can be downloaded as a *.csv file with this link: Download CSV Find the correlation coefficient and report it accurate to three decimal places. What proportion of the variation in can be explained by the variation in the values of ? Report answer as a percentage accurate to one decimal place.
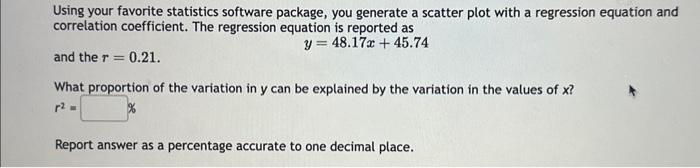
Using your favorite statistics software package, you generate a scatter plot with a regression equation and correlation coefficient. The regression equation is reported as and the . What proportion of the variation in can be explained by the variation in the values of ? Report answer as a percentage accurate to one decimal place.