Home /
Expert Answers /
Calculus /
homework-chapter-3-homework-part-1-question-16-3-1-acq-1-part-1-of-5-graphed-to-the-right-along-pa362
(Solved): Homework: Chapter 3 Homework Part 1 Question 16, 3.1.ACQ.1 Part 1 of 5 graphed to the right, along ...
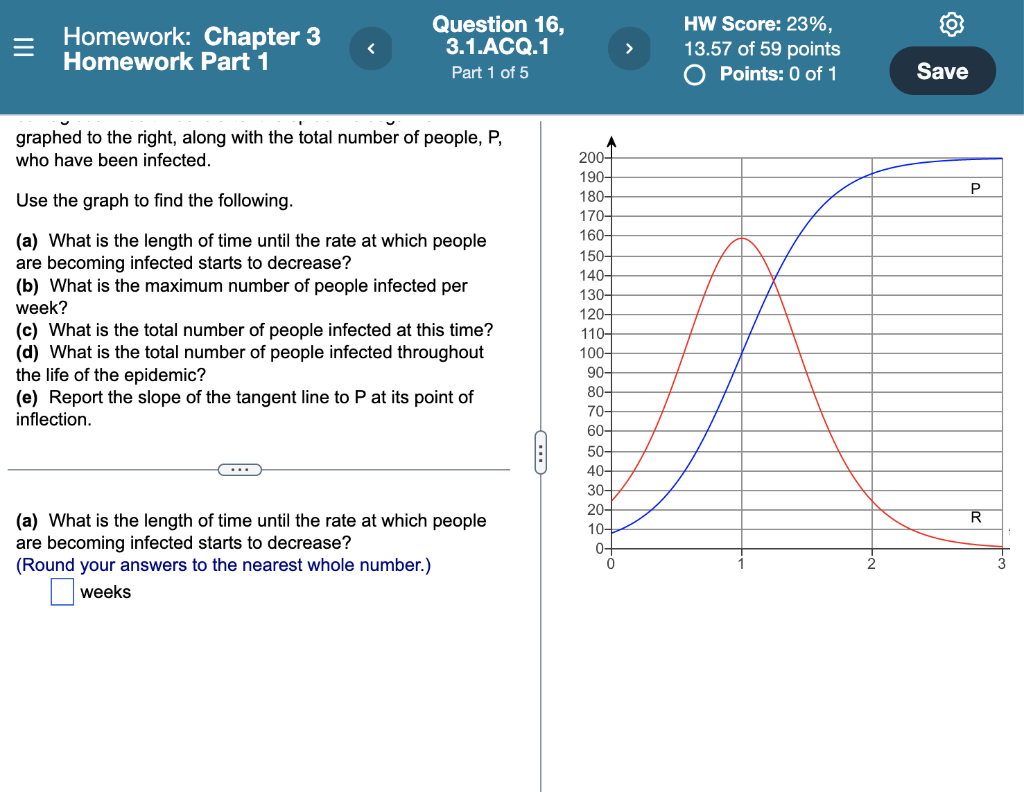
Homework: Chapter 3 Homework Part 1 Question 16, 3.1.ACQ.1 Part 1 of 5 graphed to the right, along with the total number of people, P, who have been infected. Use the graph to find the following. (a) What is the length of time until the rate at which people are becoming infected starts to decrease? (b) What is the maximum number of people infected per week? (c) What is the total number of people infected at this time? (d) What is the total number of people infected throughout the life of the epidemic? (e) Report the slope of the tangent line to P at its point of inflection. (a) What is the length of time until the rate at which people are becoming infected starts to decrease? (Round your answers to the nearest whole number.) weeks 200- 190- 180- 170- 160- 150- 140- 130- 120- 110- 100- 90- 80- 70- 60- 50- 40- 30- 20- 10- 0- 0 HW Score: 23%, 13.57 of 59 points O Points: 0 of 1 Save P R