Home /
Expert Answers /
Economics /
how-to-do-homework-assignments-11-the-graph-input-tool-the-graph-input-tool-some-questions-allow-pa606
(Solved): How to Do Homework Assignments 11. The graph input tool The graph input tool Some questions allow ...
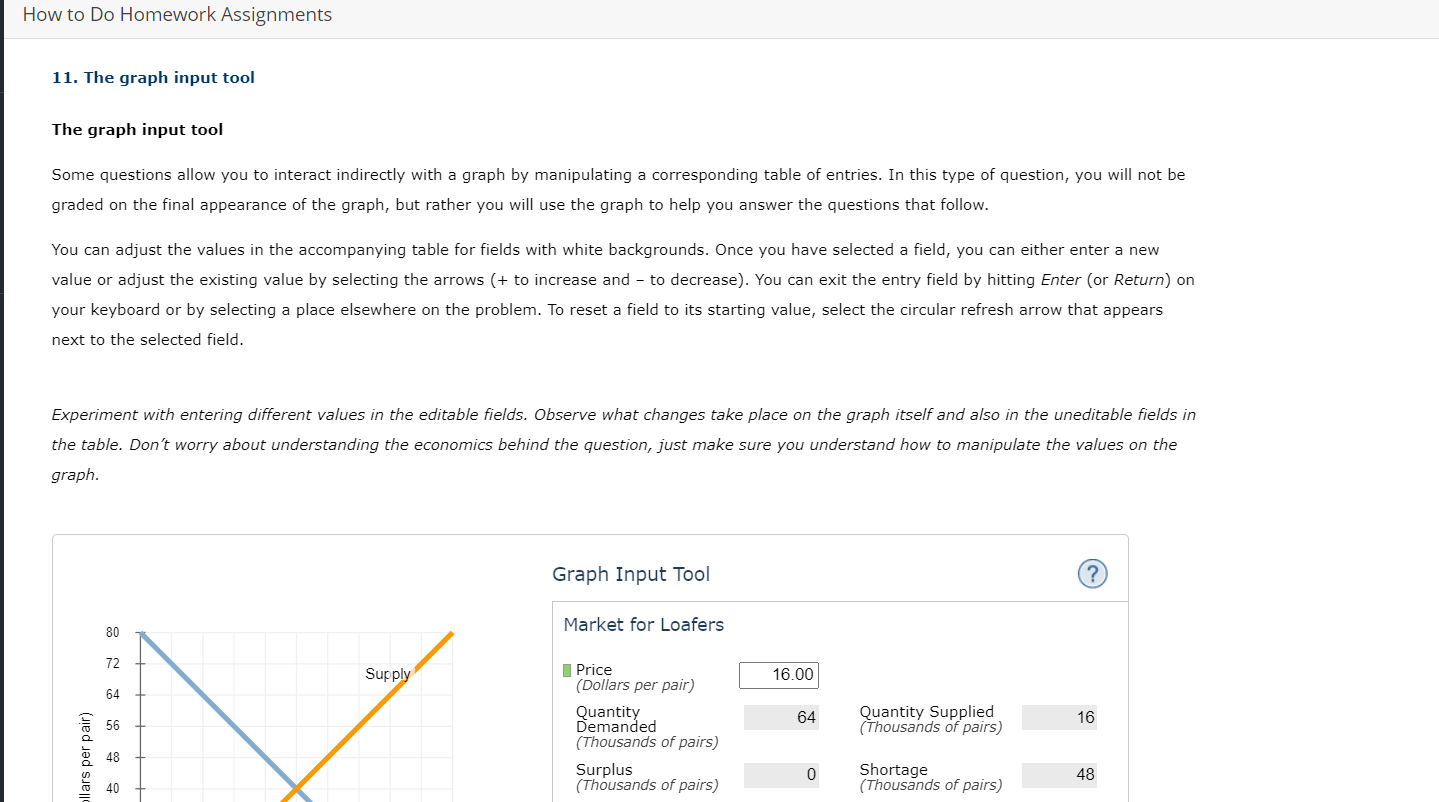
How to Do Homework Assignments 11. The graph input tool The graph input tool Some questions allow you to interact indirectly with a graph by manipulating a corresponding table of entries. In this type of question, you will not be graded on the final appearance of the graph, but rather you will use the graph to help you answer the questions that follow. You can adjust the values in the accompanying table for fields with white backgrounds. Once you have selected a field, you can either enter a new value or adjust the existing value by selecting the arrows (+ to increase and - to decrease). You can exit the entry field by hitting Enter (or Return) on your keyboard or by selecting a place elsewhere on the problem. To reset a field to its starting value, select the circular refresh arrow that appears next to the selected field. Experiment with entering different values in the editable fields. Observe what changes take place on the graph itself and also in the uneditable fields in the table. Don't worry about understanding the economics behind the question, just make sure you understand how to manipulate the values on the graph. ollars per pair) 80 72 64 40 Supply Graph Input Tool Market for Loafers Price (Dollars per pair) Quantity Demanded (Thousands of pairs) Surplus (Thousands of pairs) 16.00 64 0 Quantity Supplied (Thousands of pairs) Shortage (Thousands of pairs) 16 48
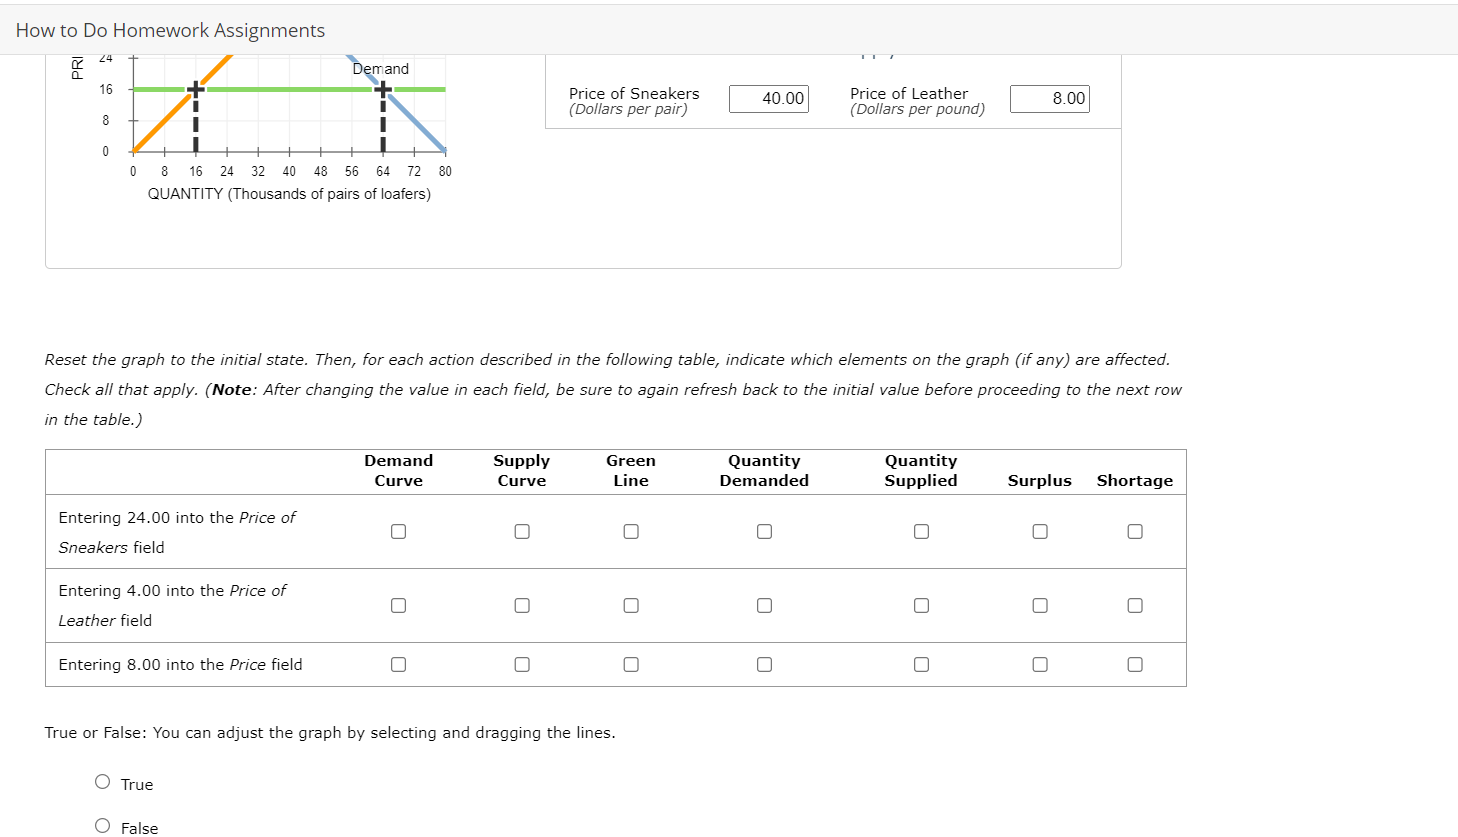
How to Do Homework Assignments PRI 24 16 8 0 # || 1 0 8 16 24 32 40 48 56 64 72 80 QUANTITY (Thousands of pairs of loafers) Entering 24.00 into the Price of Sneakers field Entering 4.00 into the Price of Leather field Entering 8.00 into the Price field Demand Reset the graph to the initial state. Then, for each action described in the following table, indicate which elements on the graph (if any) are affected. Check all that apply. (Note: After changing the value in each field, be sure to again refresh back to the initial value before proceeding to the next row in the table.) O True O False Demand Curve O Supply Curve Price of Sneakers (Dollars per pair) 0 True or False: You can adjust the graph by selecting and dragging the lines. Green Line n 0 40.00 0 Quantity Demanded Price of Leather (Dollars per pound) 0 Quantity Supplied 8.00 n Surplus Shortage 0
Expert Answer
ANSWER :- Demand Curve Supply Curve Green Line Quantity demanded Quantity Supplied Surplus Shortage Entering 24.00 into the Price of Sneakers field ?? ?? ?? Entering 4.00 into the Pric