Home /
Expert Answers /
Economics /
how-to-draw-and-label-it-the-graph-shows-the-demand-curve-for-bottled-water-and-the-supply-c-pa288
(Solved): how to draw and label it The graph shows the demand curve for bottled water and the supply c ...
how to draw and label it?
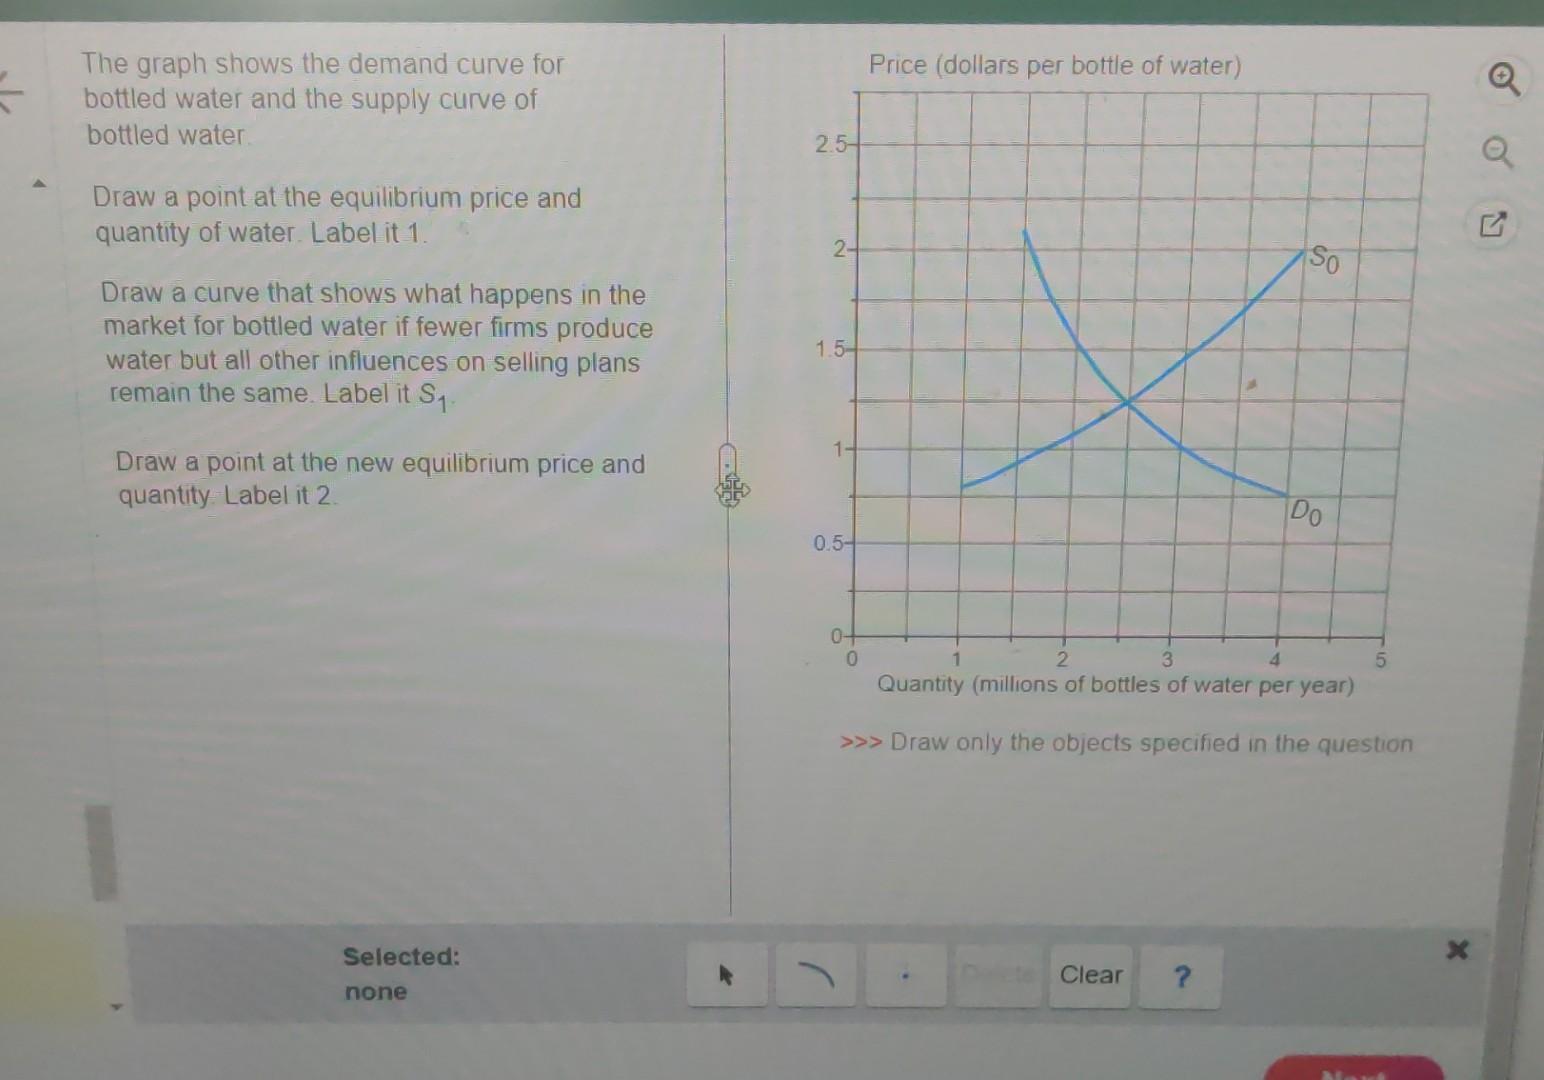
The graph shows the demand curve for bottled water and the supply curve of bottled water Draw a point at the equilibrium price and quantity of water Label it 1. Draw a curve that shows what happens in the market for bottled water if fewer firms produce water but all other influences on selling plans remain the same. Label it . Draw a point at the new equilibrium price and quantity. Label it 2. Draw only the objects specified in the question