Home /
Expert Answers /
Economics /
ii-price-controls-be-sure-to-label-the-axis-on-all-of-your-graphs-the-table-below-shows-the-deman-pa153
(Solved): II. Price Controls (be sure to label the axis on all of your graphs) The table below shows the deman ...
II. Price Controls (be sure to label the axis on all of your graphs) The table below shows the demand and supply schedules for the low-skilled labor market in the city of Jacksonville. Hourly Wage (dollars) a. C. $8.00 8.50 9.00 9.50 10.00 10.50 e. Quantity of Labor Supplied (1,000s) 10 20 30 40 50 60 Draw supply and demand curves for the labor market (This graph does not have to be drawn to scale, but make sure to label all curves and axes). b. What is the equilibrium hourly wage (W*) and the equilibrium quantity of labor (Q*)? (5 pts) If the current market wage is $10.50, how does the labor market adjust back to the equilibrium? d. If a minimum wage of $8.50 an hour is mandated, what is the quantity of labor demanded? what is the quantity of labor supplied? What is the amount of shortage or surplus in the labor market as a result of the price control? If a minimum wage of $9.50 an hour is mandated, what is the quantity of labor demanded? what is the quantity of labor supplied? What is the amount of shortage or surplus in the labor market as a result of the price control? f. Using the supply and demand graph in part (a) above, illustrate the effect of the price control. Quantity of Labor Demanded (1,000s) 50 40 30 20 10 0
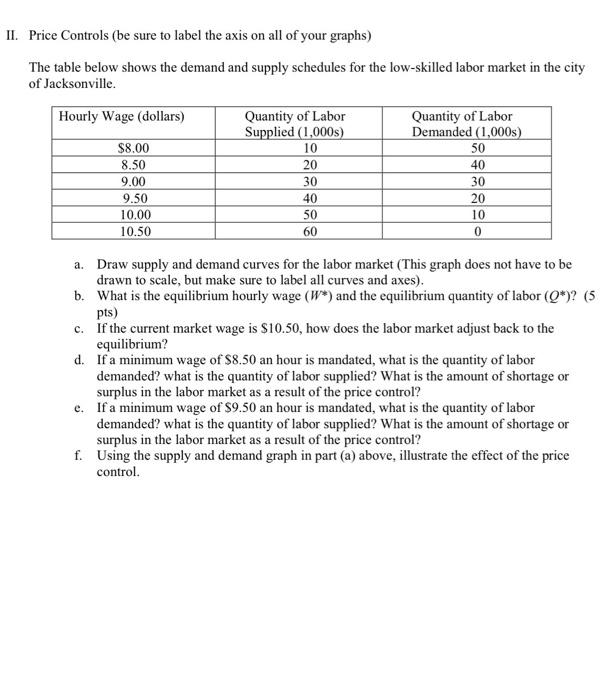
Price Controls (be sure to label the axis on all of your graphs) The table below shows the demand and supply schedules for the low-skilled labor market in the city of Jacksonville. a. Draw supply and demand curves for the labor market (This graph does not have to be drawn to scale, but make sure to label all curves and axes). b. What is the equilibrium hourly wage and the equilibrium quantity of labor ? pts) c. If the current market wage is , how does the labor market adjust back to the equilibrium? d. If a minimum wage of an hour is mandated, what is the quantity of labor demanded? what is the quantity of labor supplied? What is the amount of shortage or surplus in the labor market as a result of the price control? e. If a minimum wage of an hour is mandated, what is the quantity of labor demanded? what is the quantity of labor supplied? What is the amount of shortage or surplus in the labor market as a result of the price control? f. Using the supply and demand graph in part (a) above, illustrate the effect of the price control.
Expert Answer
The labor market is a fundamental aspect of any economy, and supply and demand determine the equilib...