Home /
Expert Answers /
Economics /
in-the-diagram-curves-1-2-and-3-represent-select-one-a-total-fixed-cost-total-variable-cost-pa421
(Solved): In the diagram, curves 1,2 , and 3 represent: Select one: A. total fixed cost, total variable cost ...
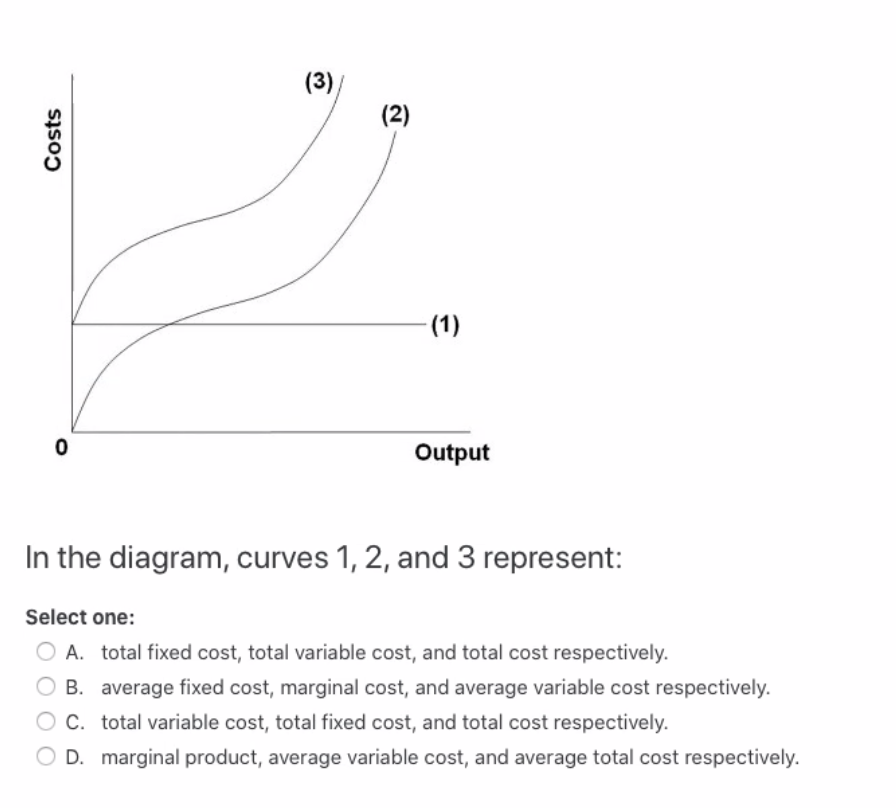
In the diagram, curves 1,2 , and 3 represent: Select one: A. total fixed cost, total variable cost, and total cost respectively. B. average fixed cost, marginal cost, and average variable cost respectively. C. total variable cost, total fixed cost, and total cost respectively. D. marginal product, average variable cost, and average total cost respectively.
Expert Answer
Ans:in the diagram,curves 1,2