Home /
Expert Answers /
Statistics and Probability /
making-a-grouped-frequency-distribution-quantitative-data-1-press-ctrl-n-for-a-new-workbook-2-pa215
(Solved): Making a Grouped Frequency Distribution (Quantitative Data) 1. Press [Ctrl]-N for a new workbook. 2 ...
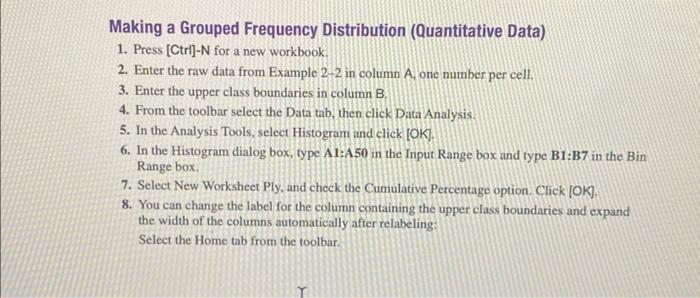
Making a Grouped Frequency Distribution (Quantitative Data) 1. Press [Ctrl]-N for a new workbook. 2. Enter the raw data from Example in column , one number per cell. 3. Enter the upper class boundaries in column B. 4. From the toolbar select the Data tab, then click Data Analysis. 5. In the Analysis Tools, select Histogram and click [OK]. 6. In the Histogram dialog box, type A1:A50 in the Input Range box and type B1:B7 in the Bin Range box. 7. Select New Worksheet Ply, and check the Cumulative Percentage option. Click [OK]. 8. You can change the label for the column containing the upper class boundaries and expand the width of the columns automatically after relabeling: Select the Home tab from the toolbar.