Home /
Expert Answers /
Algebra /
math-0130-tutorial-5-quadratic-and-higher-degree-polynomial-functions-a-projectile-motion-pa148
(Solved): Math 0130 Tutorial 5: Quadratic and Higher Degree Polynomial Functions A. Projectile Motion ...
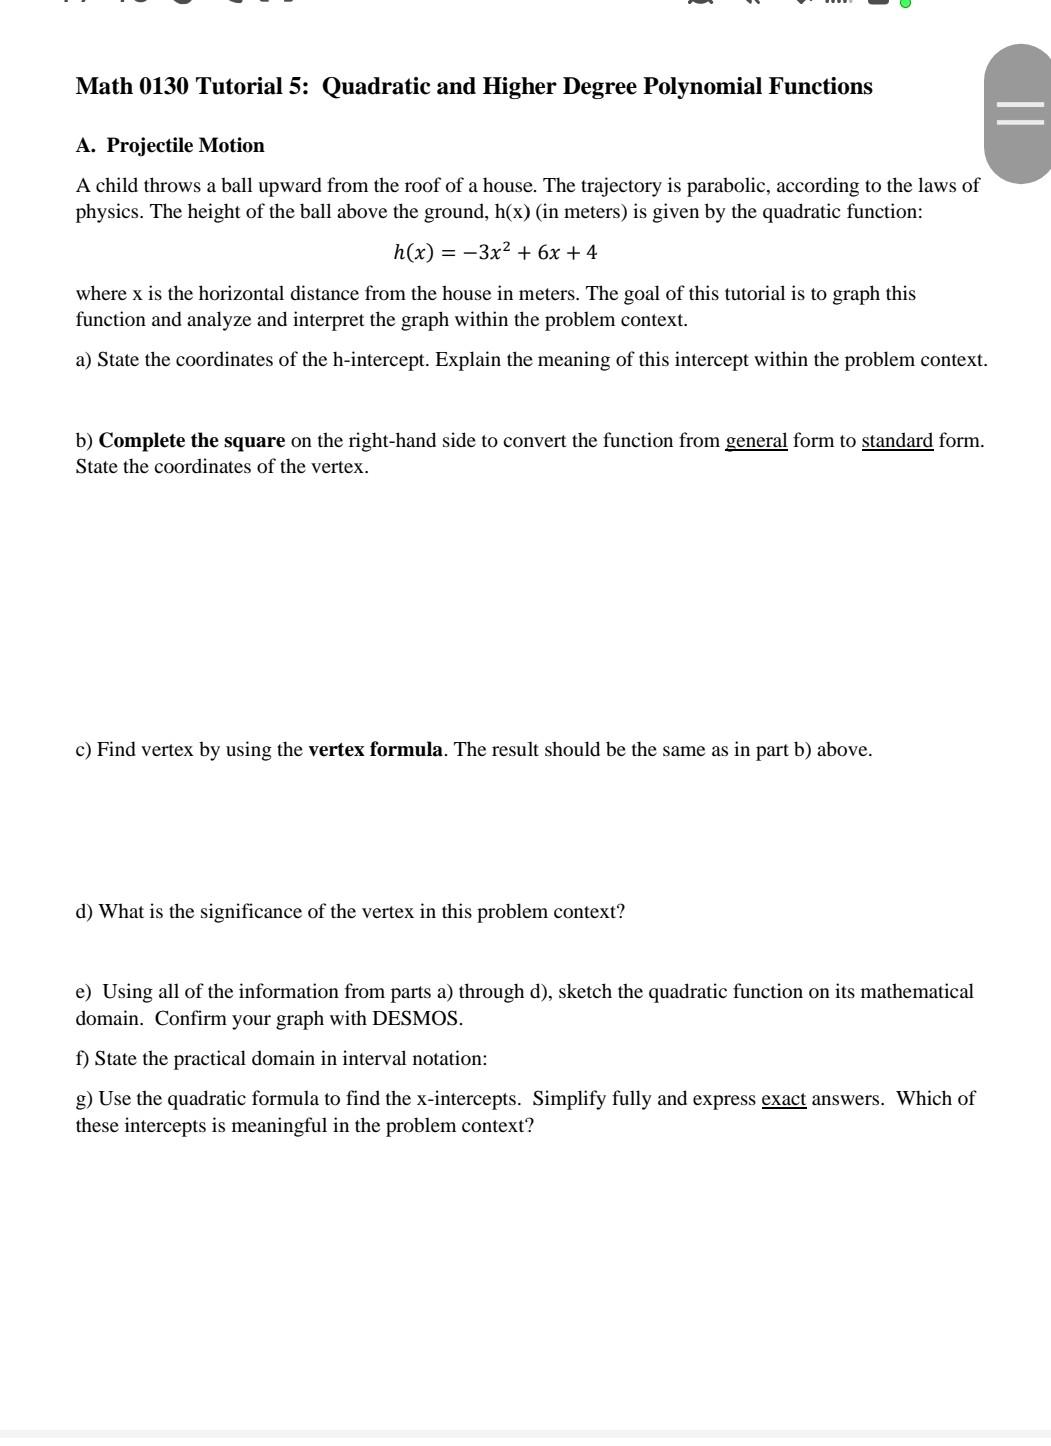
Math 0130 Tutorial 5: Quadratic and Higher Degree Polynomial Functions A. Projectile Motion A child throws a ball upward from the roof of a house. The trajectory is parabolic, according to the laws of physics. The height of the ball above the ground, (in meters) is given by the quadratic function: where is the horizontal distance from the house in meters. The goal of this tutorial is to graph this function and analyze and interpret the graph within the problem context. a) State the coordinates of the h-intercept. Explain the meaning of this intercept within the problem context. b) Complete the square on the right-hand side to convert the function from general form to standard form. State the coordinates of the vertex. c) Find vertex by using the vertex formula. The result should be the same as in part b) above. d) What is the significance of the vertex in this problem context? e) Using all of the information from parts a) through d), sketch the quadratic function on its mathematical domain. Confirm your graph with DESMOS. f) State the practical domain in interval notation: g) Use the quadratic formula to find the x-intercepts. Simplify fully and express exact answers. Which of these intercepts is meaningful in the problem context?
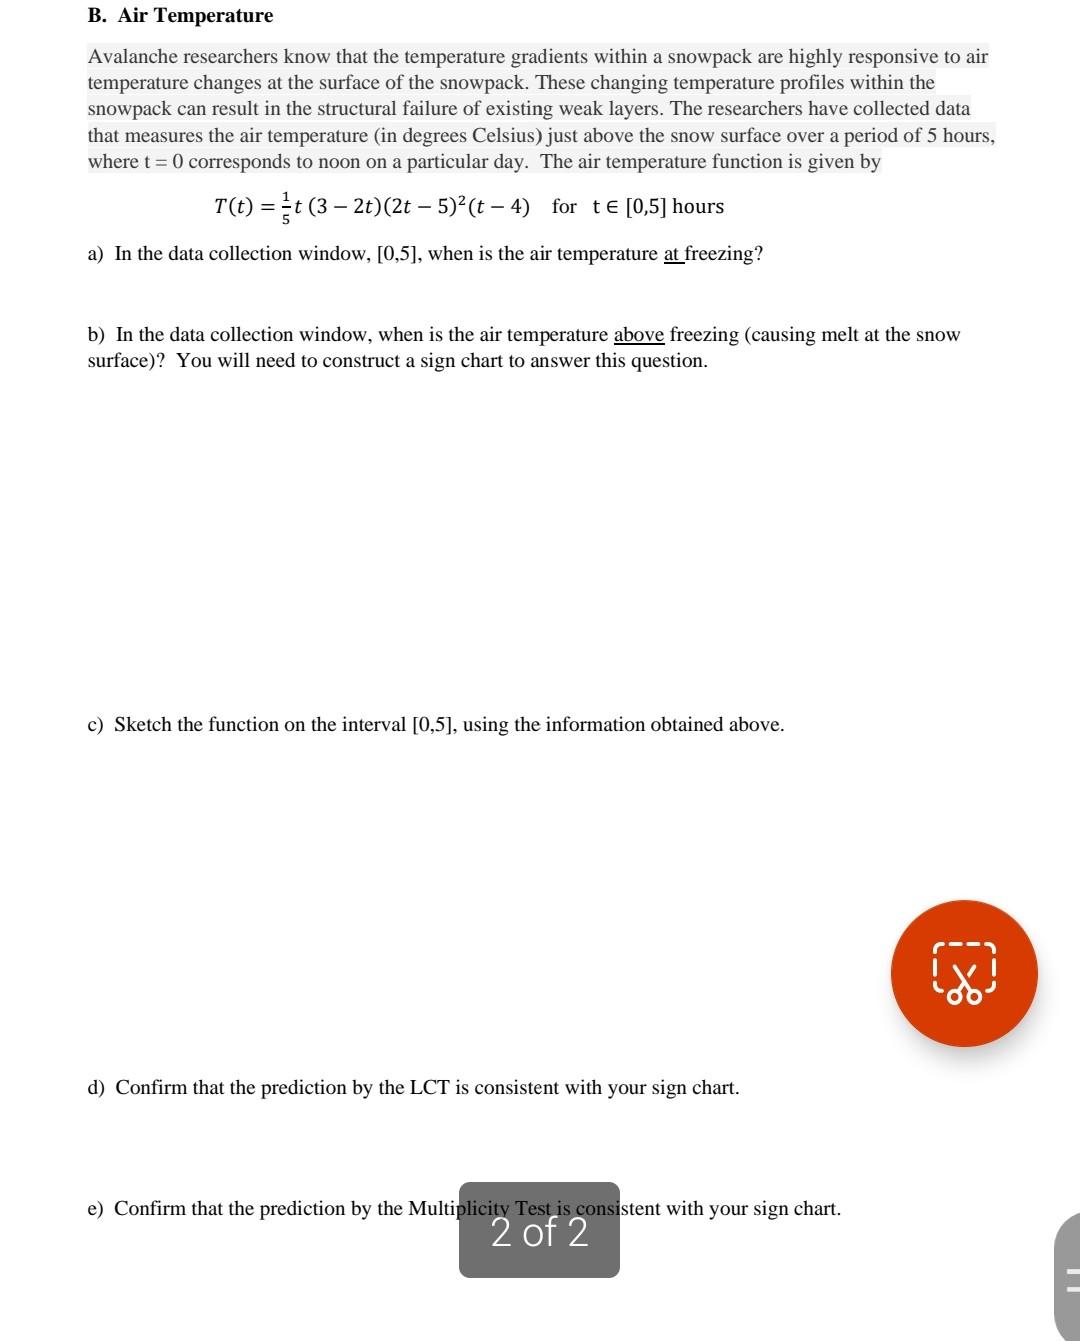
B. Air Temperature Avalanche researchers know that the temperature gradients within a snowpack are highly responsive to air temperature changes at the surface of the snowpack. These changing temperature profiles within the snowpack can result in the structural failure of existing weak layers. The researchers have collected data that measures the air temperature (in degrees Celsius) just above the snow surface over a period of 5 hours, where corresponds to noon on a particular day. The air temperature function is given by a) In the data collection window, , when is the air temperature at freezing? b) In the data collection window, when is the air temperature above freezing (causing melt at the snow surface)? You will need to construct a sign chart to answer this question. c) Sketch the function on the interval , using the information obtained above. d) Confirm that the prediction by the LCT is consistent with your sign chart. e) Confirm that the prediction by the Multiplicity Test is consistent with your sign chart.