(Solved): Multiple Regression in R - Please use R coding methods to answer the following (not sure if this is ...
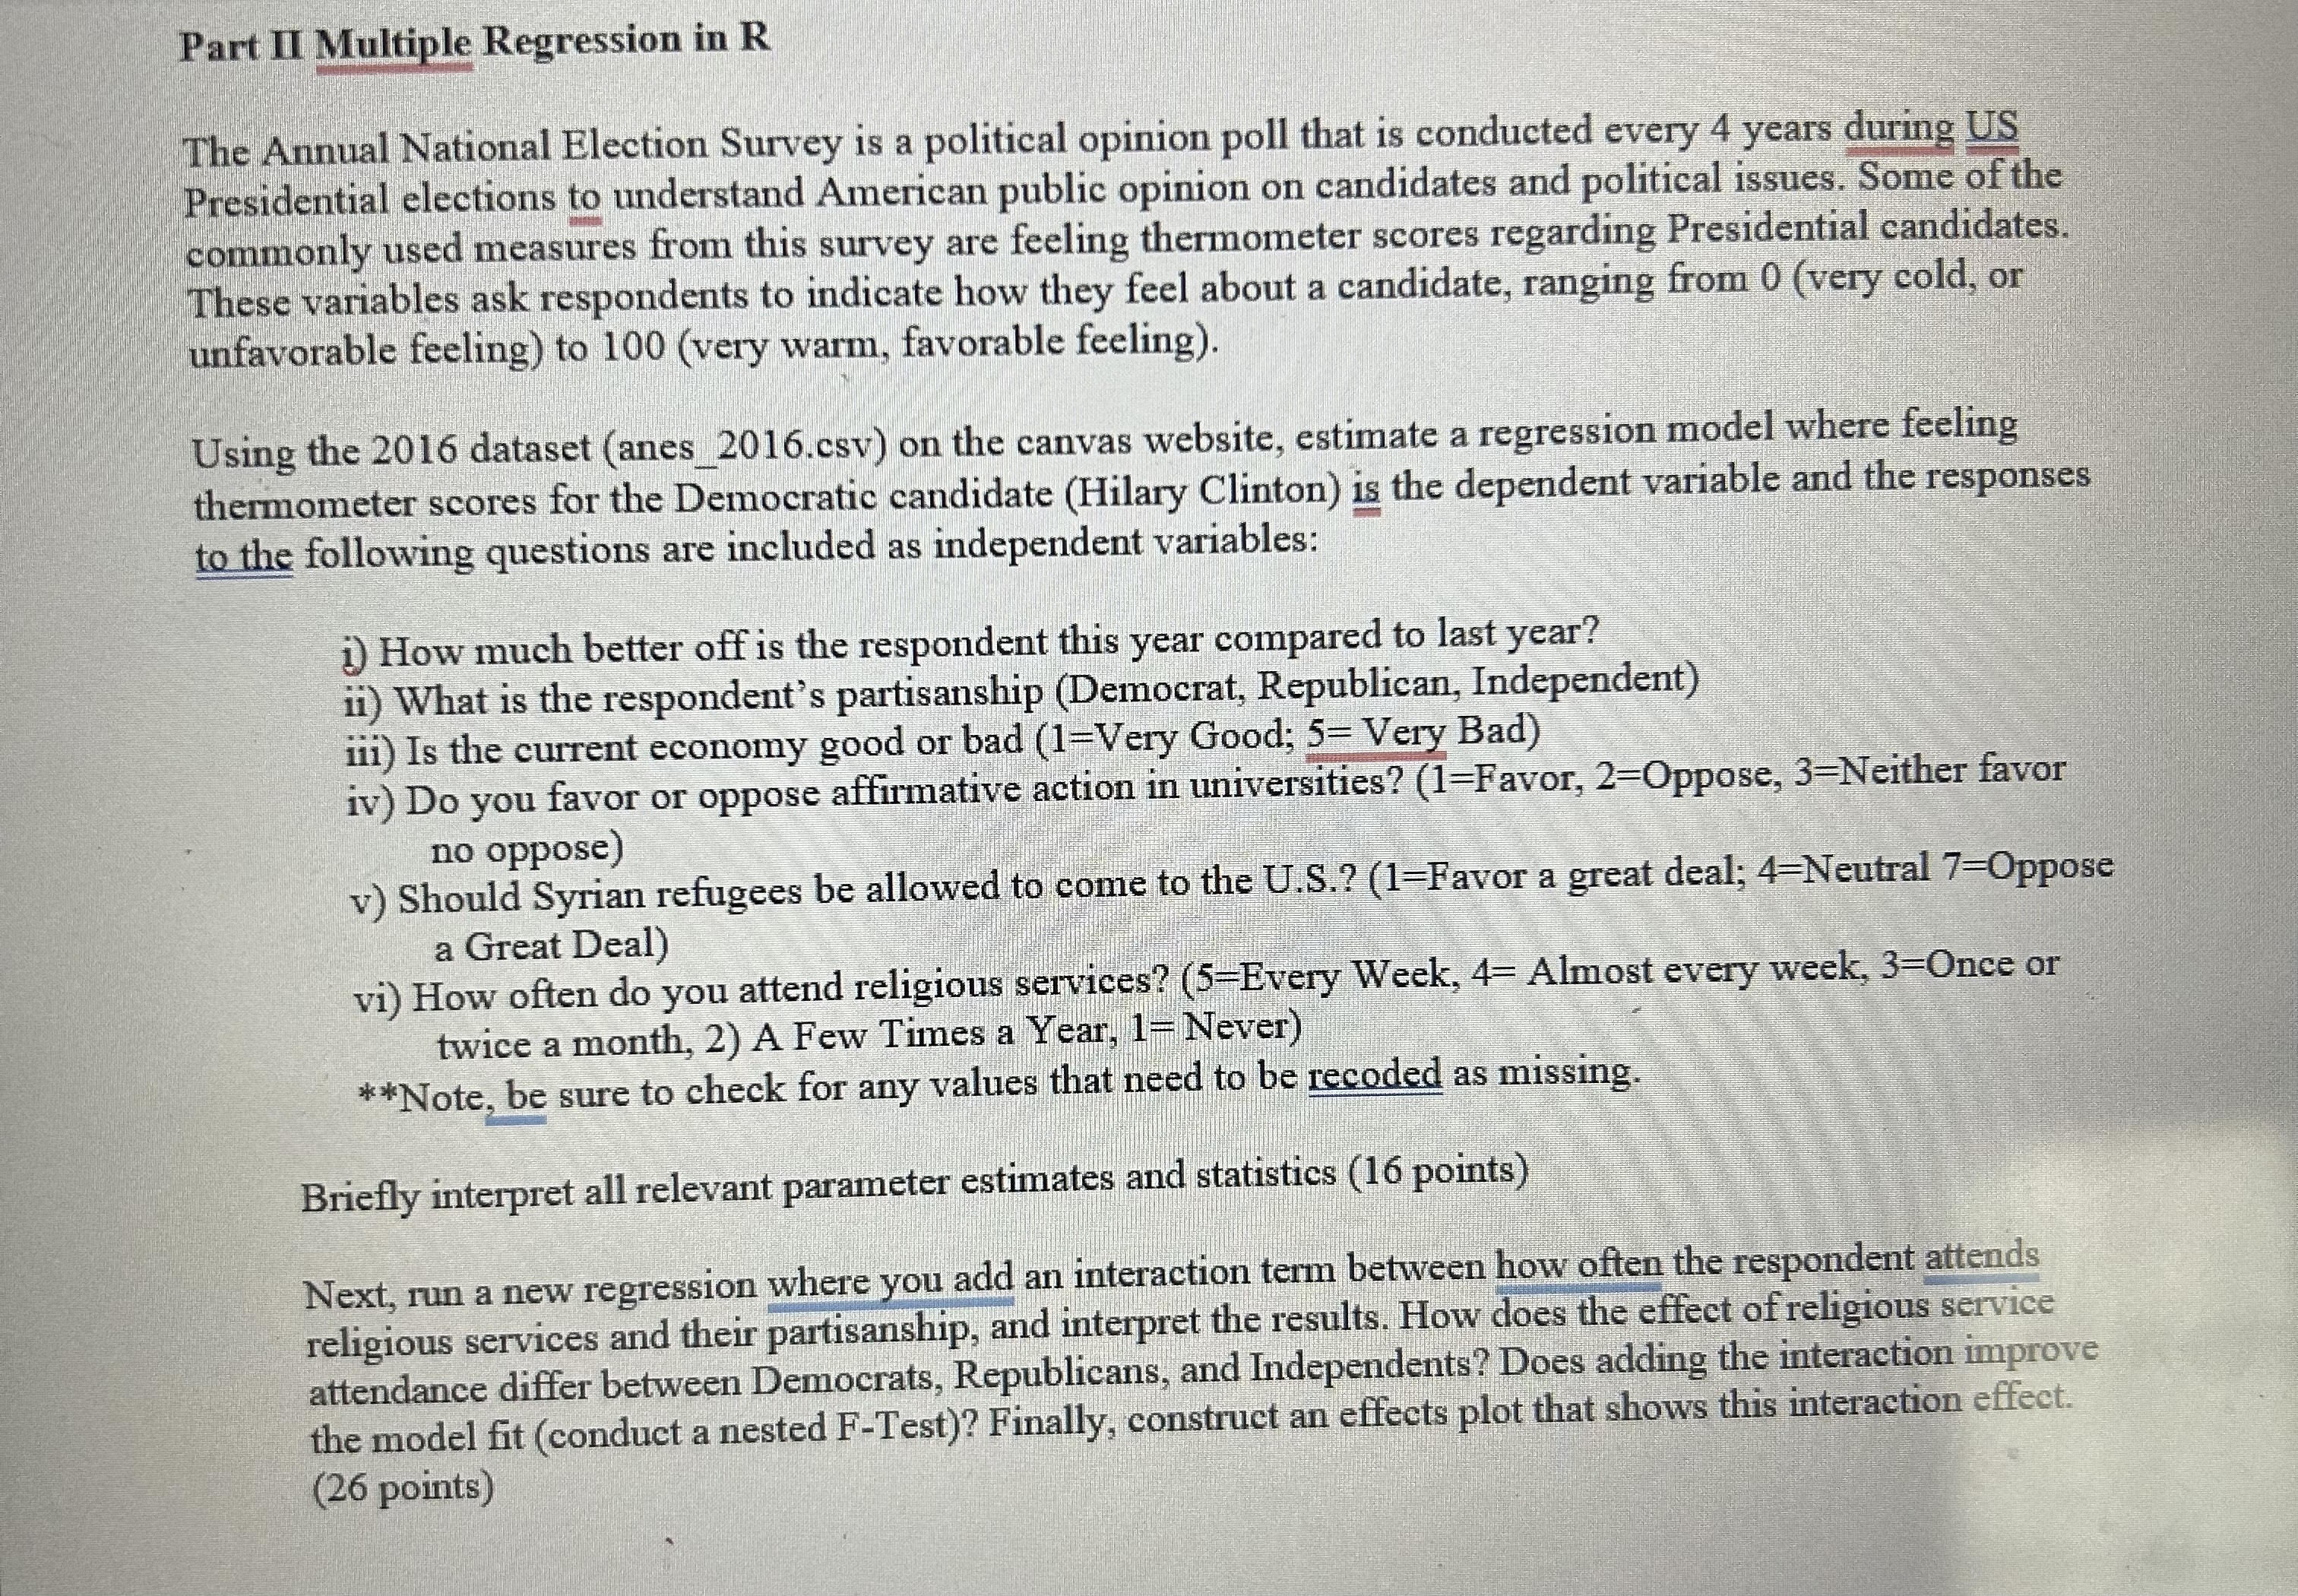
Multiple Regression in R - Please use R coding methods to answer the following (not sure if this is possible to explain without the proper dataset, but I cannot attach the .csv file): The Annual National Election Survey is a political opinion poll that is conducted every 4 years during US Presidential elections to understand American public opinion on candidates and political issues. Some of the commonly used measures from this survey are feeling thermometer scores regarding Presidential candidates. These variables ask respondents to indicate how they feel about a candidate, ranging from 0 (very cold, or unfavorable feeling) to 100 (very warm, favorable feeling). Using the 2016 dataset (anes_2016.csv) on the canvas website, estimate a regression model where feeling thermometer scores for the Democratic candidate (Hilary Clinton) is the dependent variable and the responses to the following questions are included as independent variables: i) How much better off is the respondent this year compared to last year? ii) What is the respondent's partisanship (Democrat, Republican, Independent) iii) Is the current economy good or bad (1=Very Good; 5=Very Bad) iv) Do you favor or oppose affirmative action in universities? ( 1=Favor,2=Oppose,3= Neither favor no oppose) v) Should Syrian refugees be allowed to come to the U.S.? ( 1= Favor a great deal; 4= Neutral 7= Oppose a Great Deal) vi) How often do you attend religious services? ( 5= Every Week, 4= Almost every week, 3= Once or twice a month, 2) A Few Times a Year, 1=Never) **Note, be sure to check for any values that need to be recoded as missing. Briefly interpret all relevant parameter estimates and statistics Next, run a new regression where you add an interaction term between how often the respondent attends religious services and their partisanship, and interpret the results. How does the effect of religious service attendance differ between Democrats, Republicans, and Independents? Does adding the interaction improve the model fit (conduct a nested F-Test)? Finally, construct an effects plot that shows this interaction effect.