Home /
Expert Answers /
Algebra /
nbsp-nbsp-nbsp-nbsp-nbsp-use-technology-to-compute-the-standard-deviation-for-t-pa850
(Solved): Use technology to compute the standard deviation for t ...
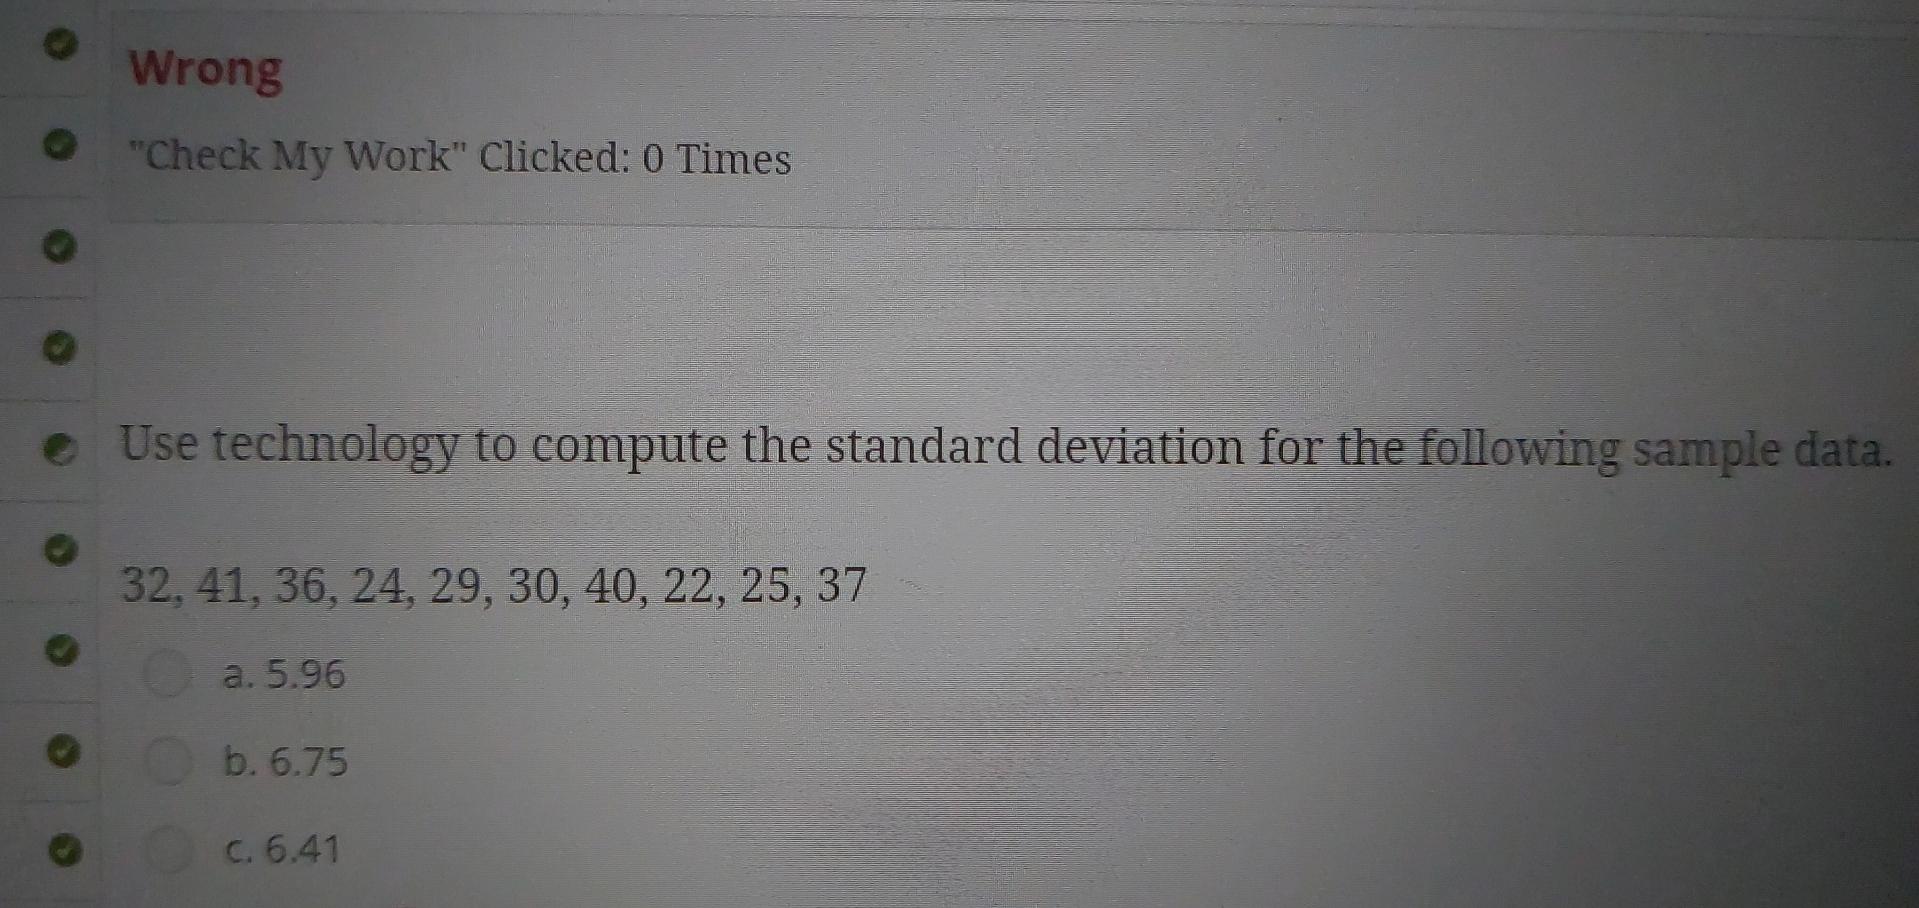
Use technology to compute the standard deviation for the following sample data. \( 32,41,36,24,29,30,40,22,25,37 \) a. \( 5.96 \) b. \( 6.75 \) c. \( 6.41 \)
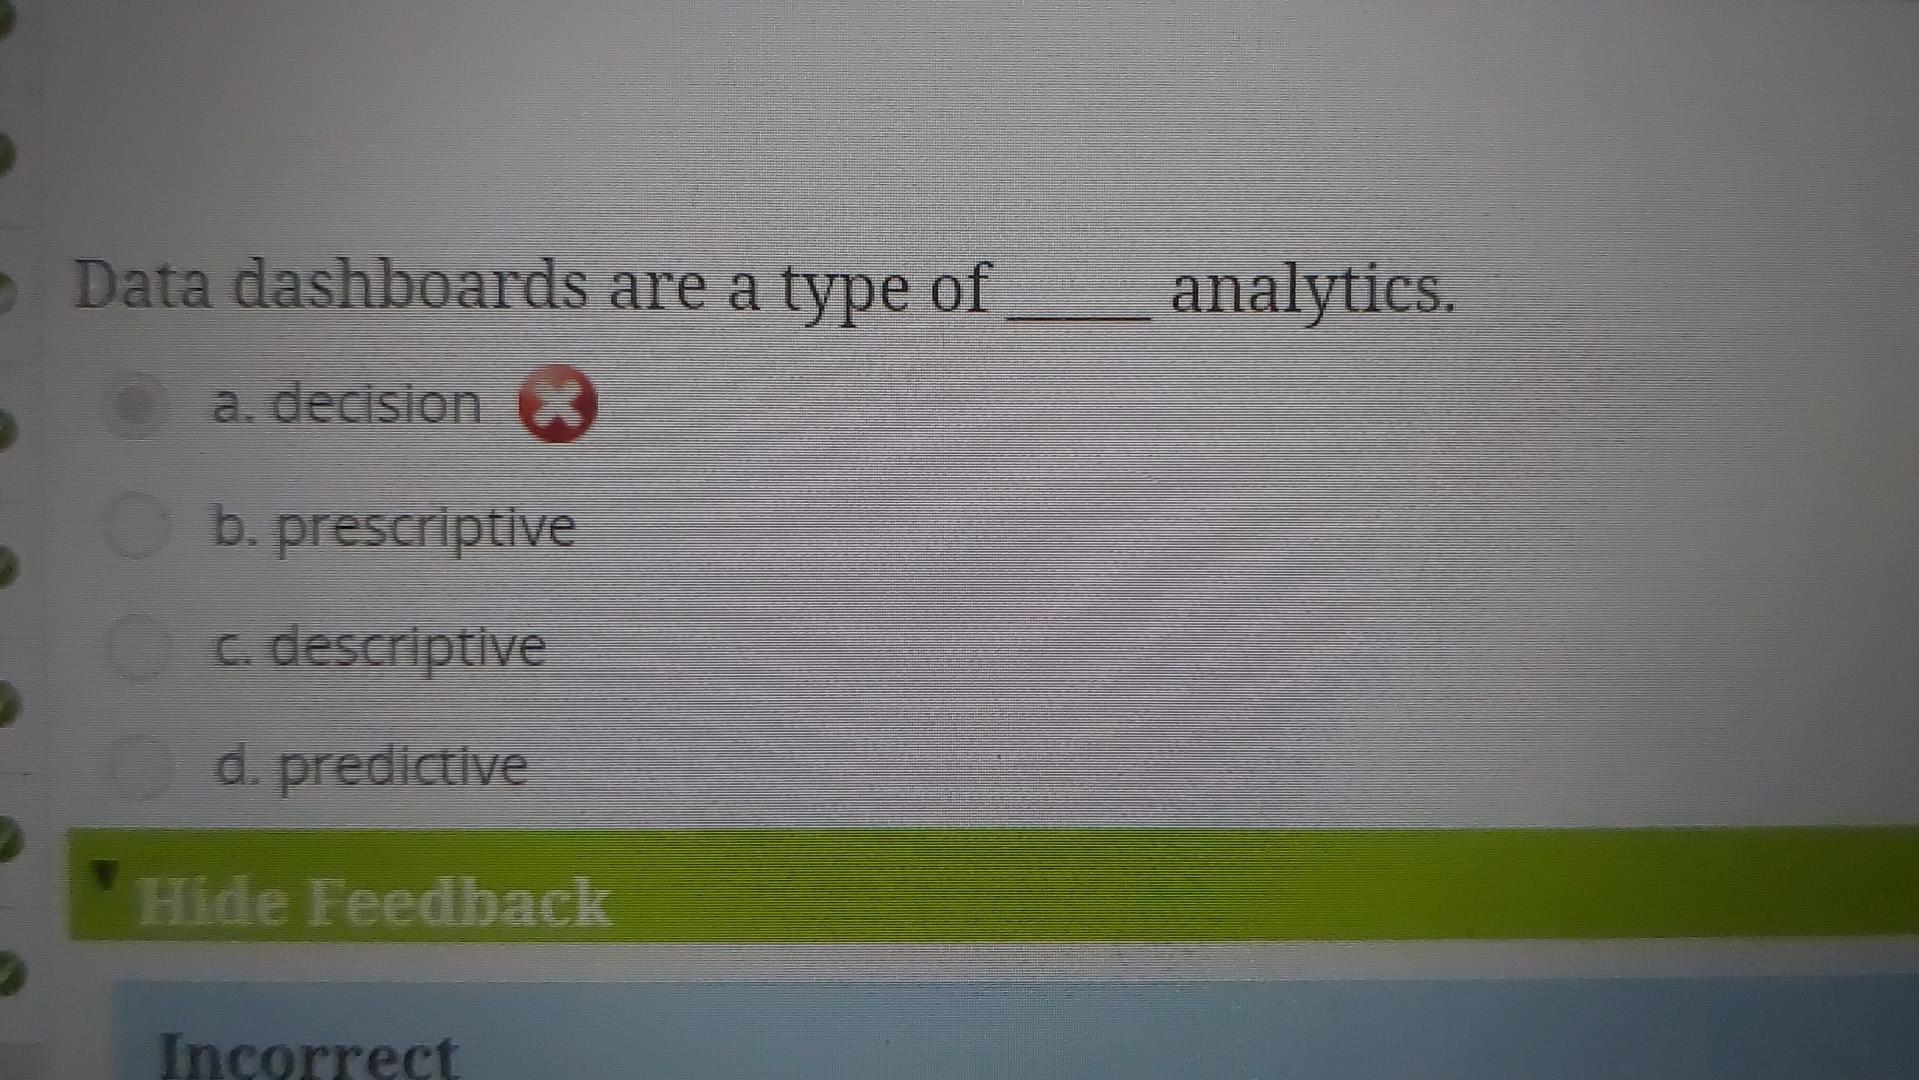
Data dashboards are a type of analytics. a. decision b. prescriptive c. descriptive d. predictive Hide Feedback
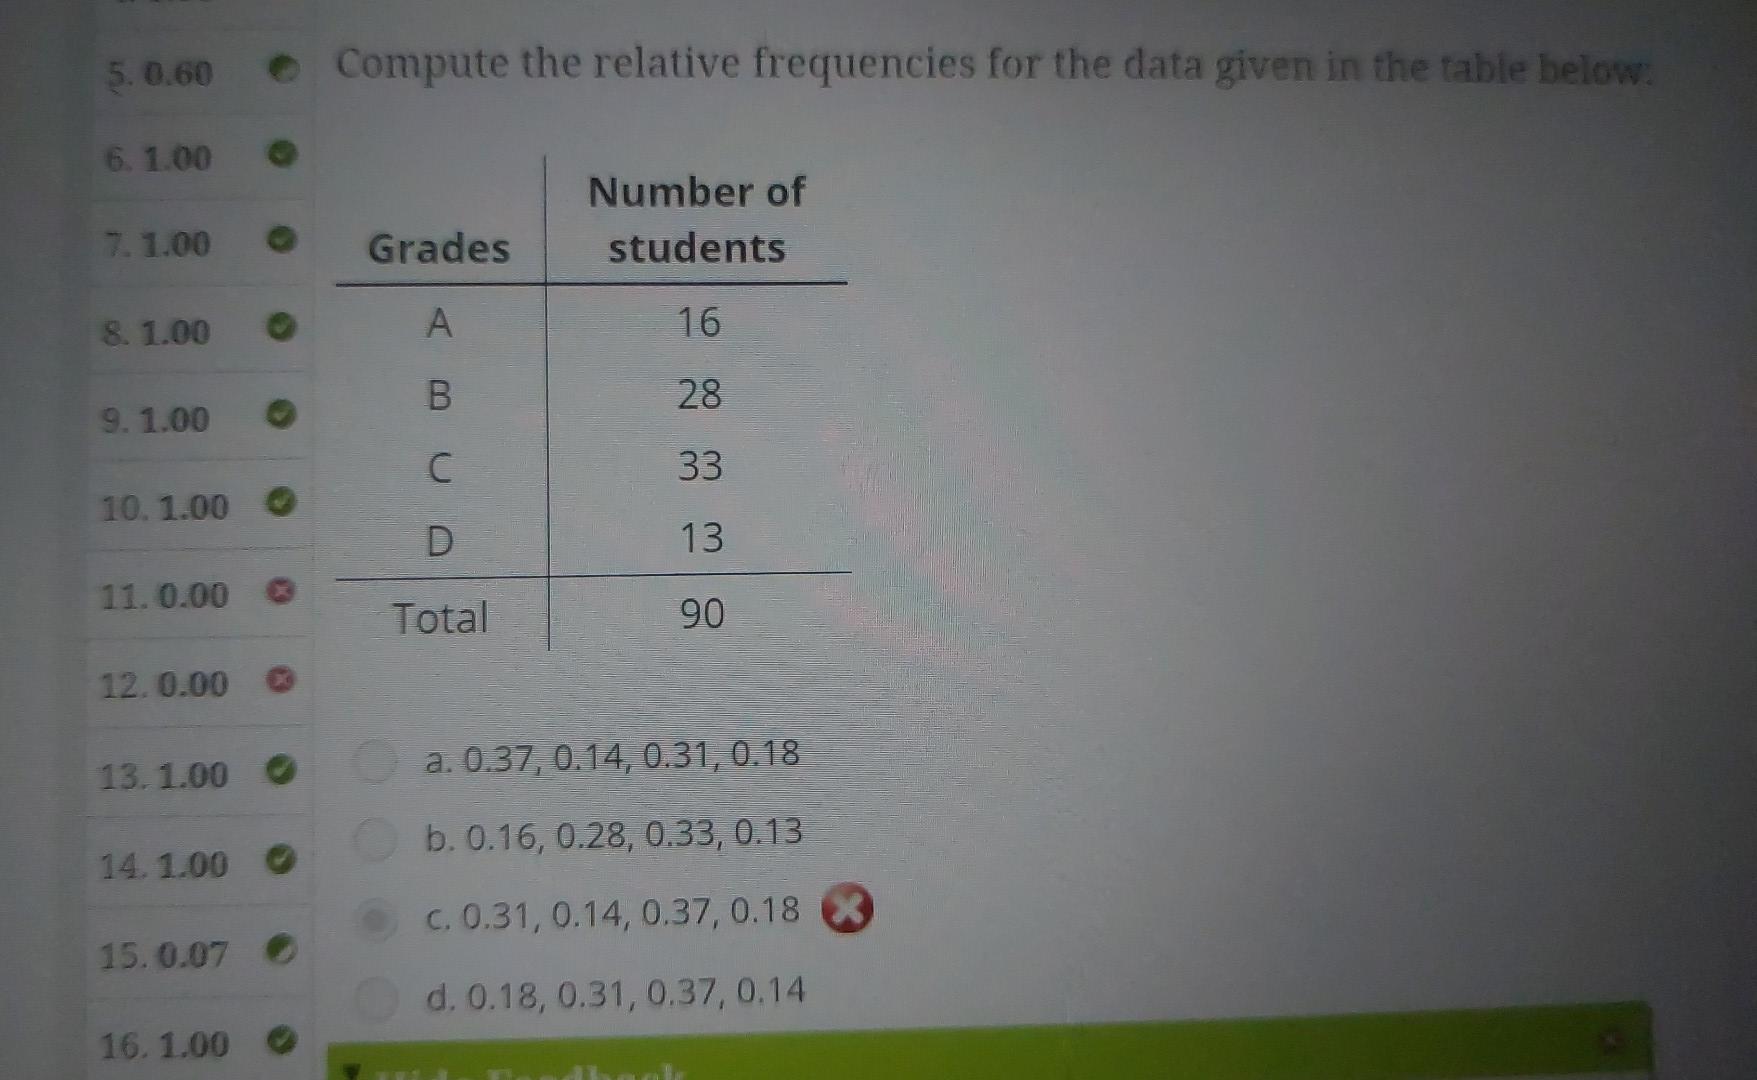
Compute the relative frequencies for the data given in the table below: a. \( 0.37,0.14,0.31,0.18 \) b. \( 0.16,0.28,0.33,0.13 \) c. \( 0.31,0.14,0.37,0.18 \) d. \( 0.18,0.31,0.37,0.14 \)
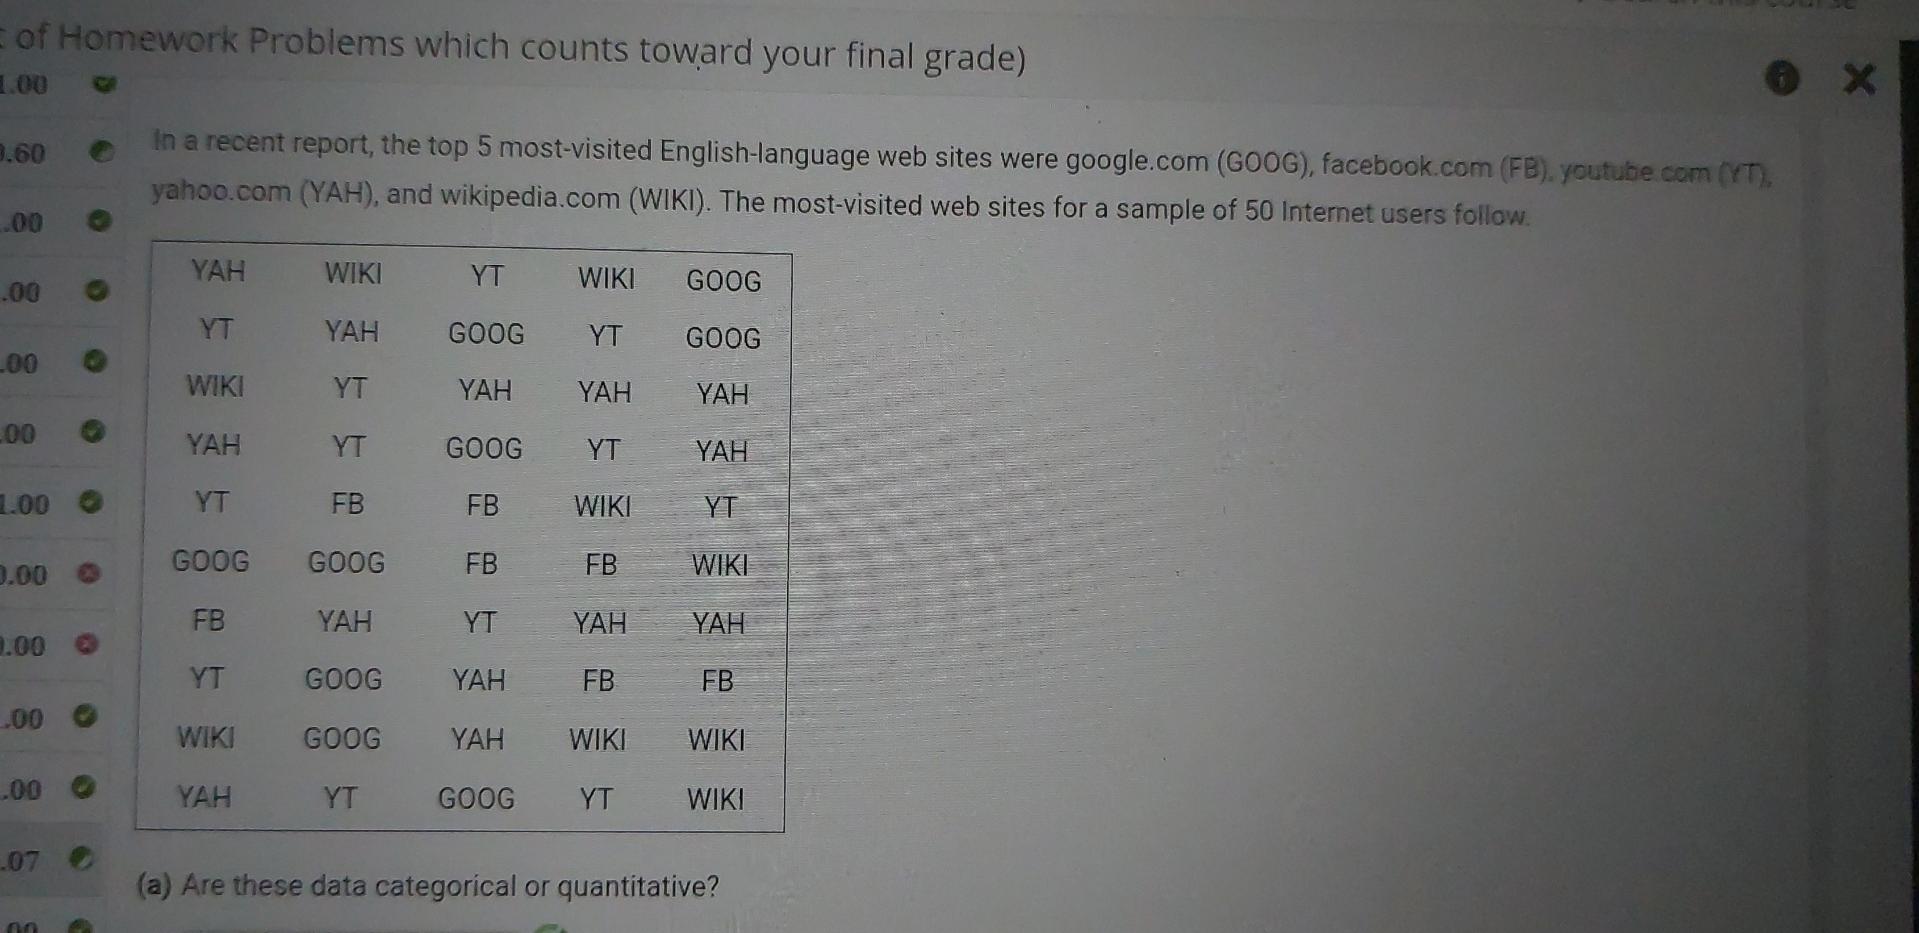
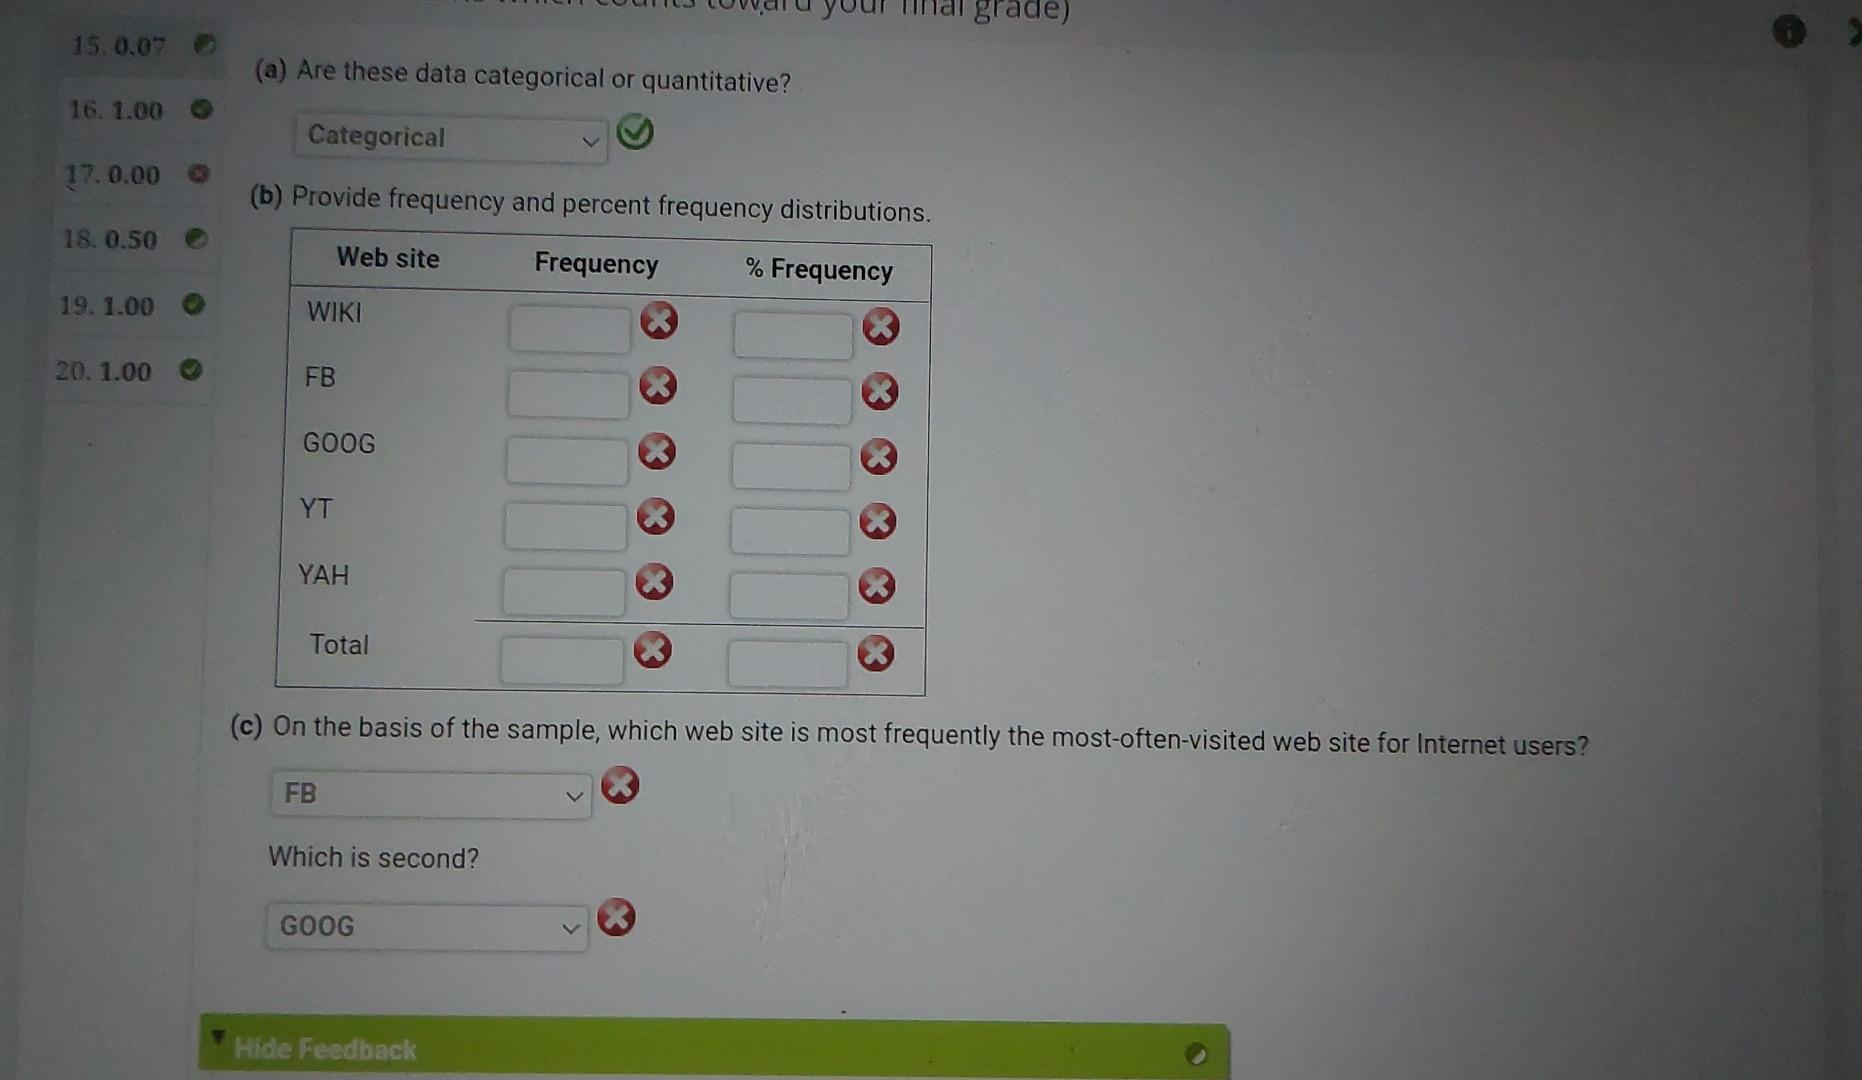
of Homework Problems which counts toward your final grade) 00 60 In a recent report, the top 5 most-visited English-language web sites were google.com (G00G), facebook.com (FB), youtute com (irT), yahoo.com (YAH), and wikipedia.com (WIKI). The most-visited web sites for a sample of 50 Internet users follow. (a) Are these data categorical or quantitative?
(a) Are these data categorical or quantitative? (b) Provide frequency and percent frequency distributions. ) On the basis of the sample, which web site is most frequ Which is second?