Home /
Expert Answers /
Statistics and Probability /
nbsp-question-2-1-point-the-graph-below-shows-the-graphs-of-several-normal-distributions-lab-pa973
(Solved): QUESTION 2 . 1 POINT The graph below shows the graphs of several normal distributions, lab ...
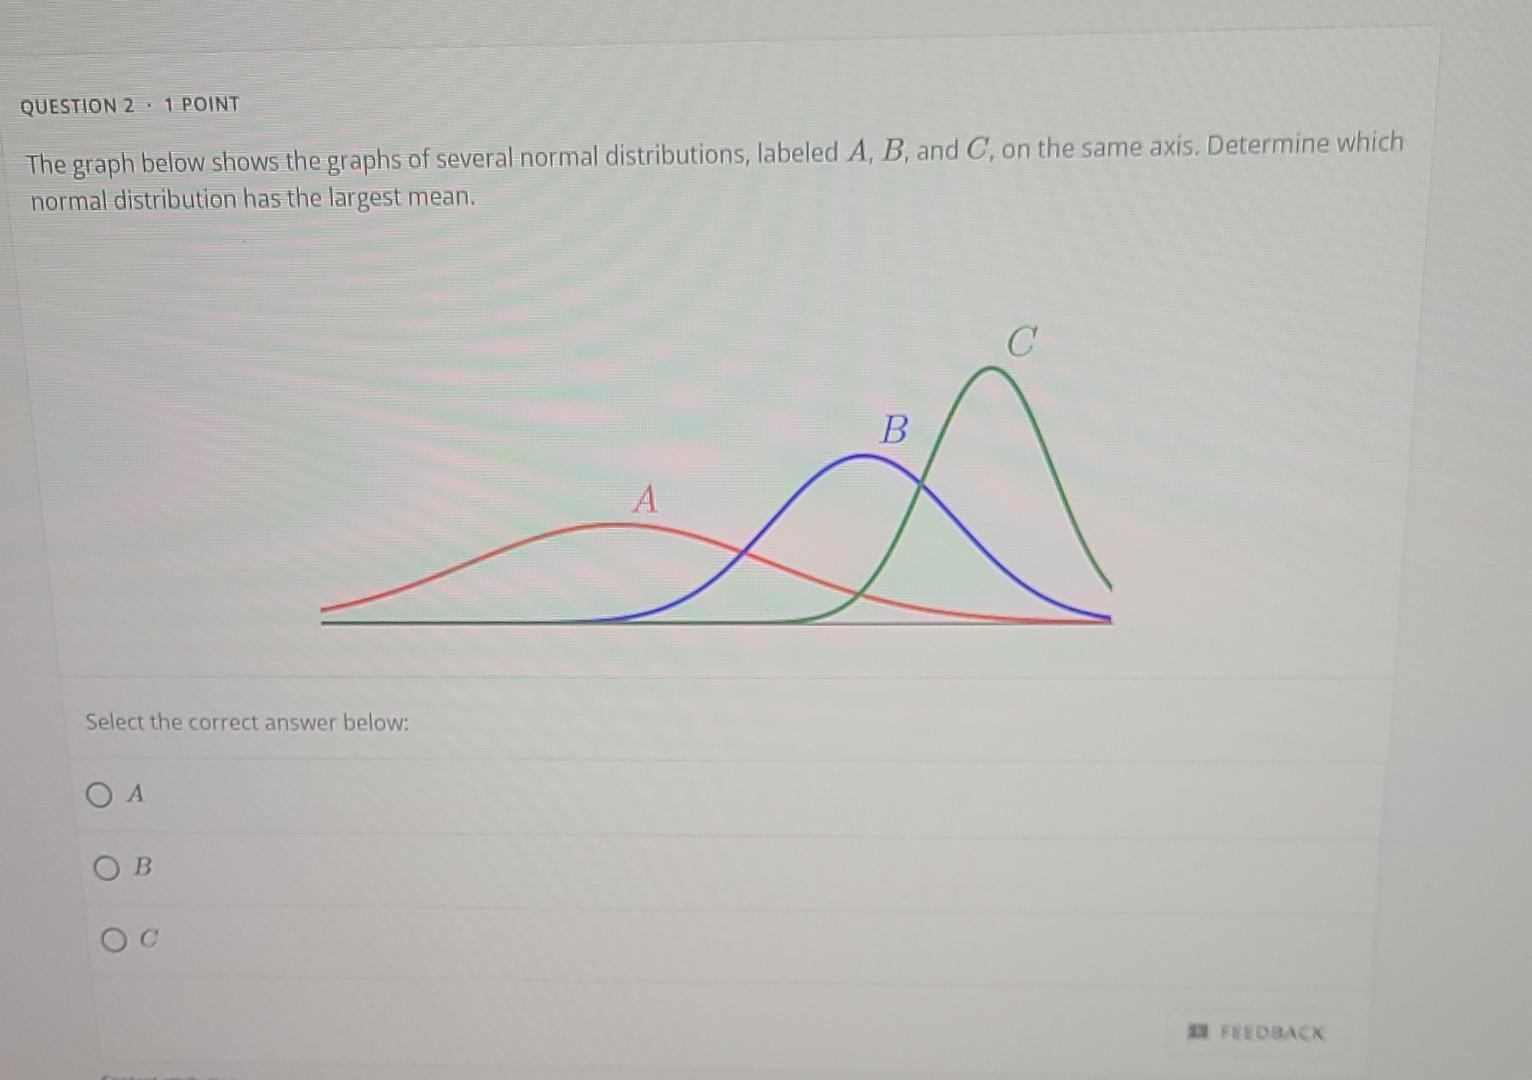
QUESTION 2 . 1 POINT The graph below shows the graphs of several normal distributions, labeled A, B, and C, on the same axis. Determine which normal distribution has the largest mean. ? B A Select the correct answer below: ? ? B B FEEDBACK
Expert Answer
From the given data : A, B and C are normal distribution graphs 1. The curve which has highest line of s