Home /
Expert Answers /
Civil Engineering /
need-it-asap-1-suppose-that-the-diagram-below-dohse-unca-shows-a-nodal-diagram-for-a-pa741
(Solved): Need it asap! 1. Suppose that the diagram below [Dohse, UNCA] shows a nodal diagram for a ...
Need it asap!
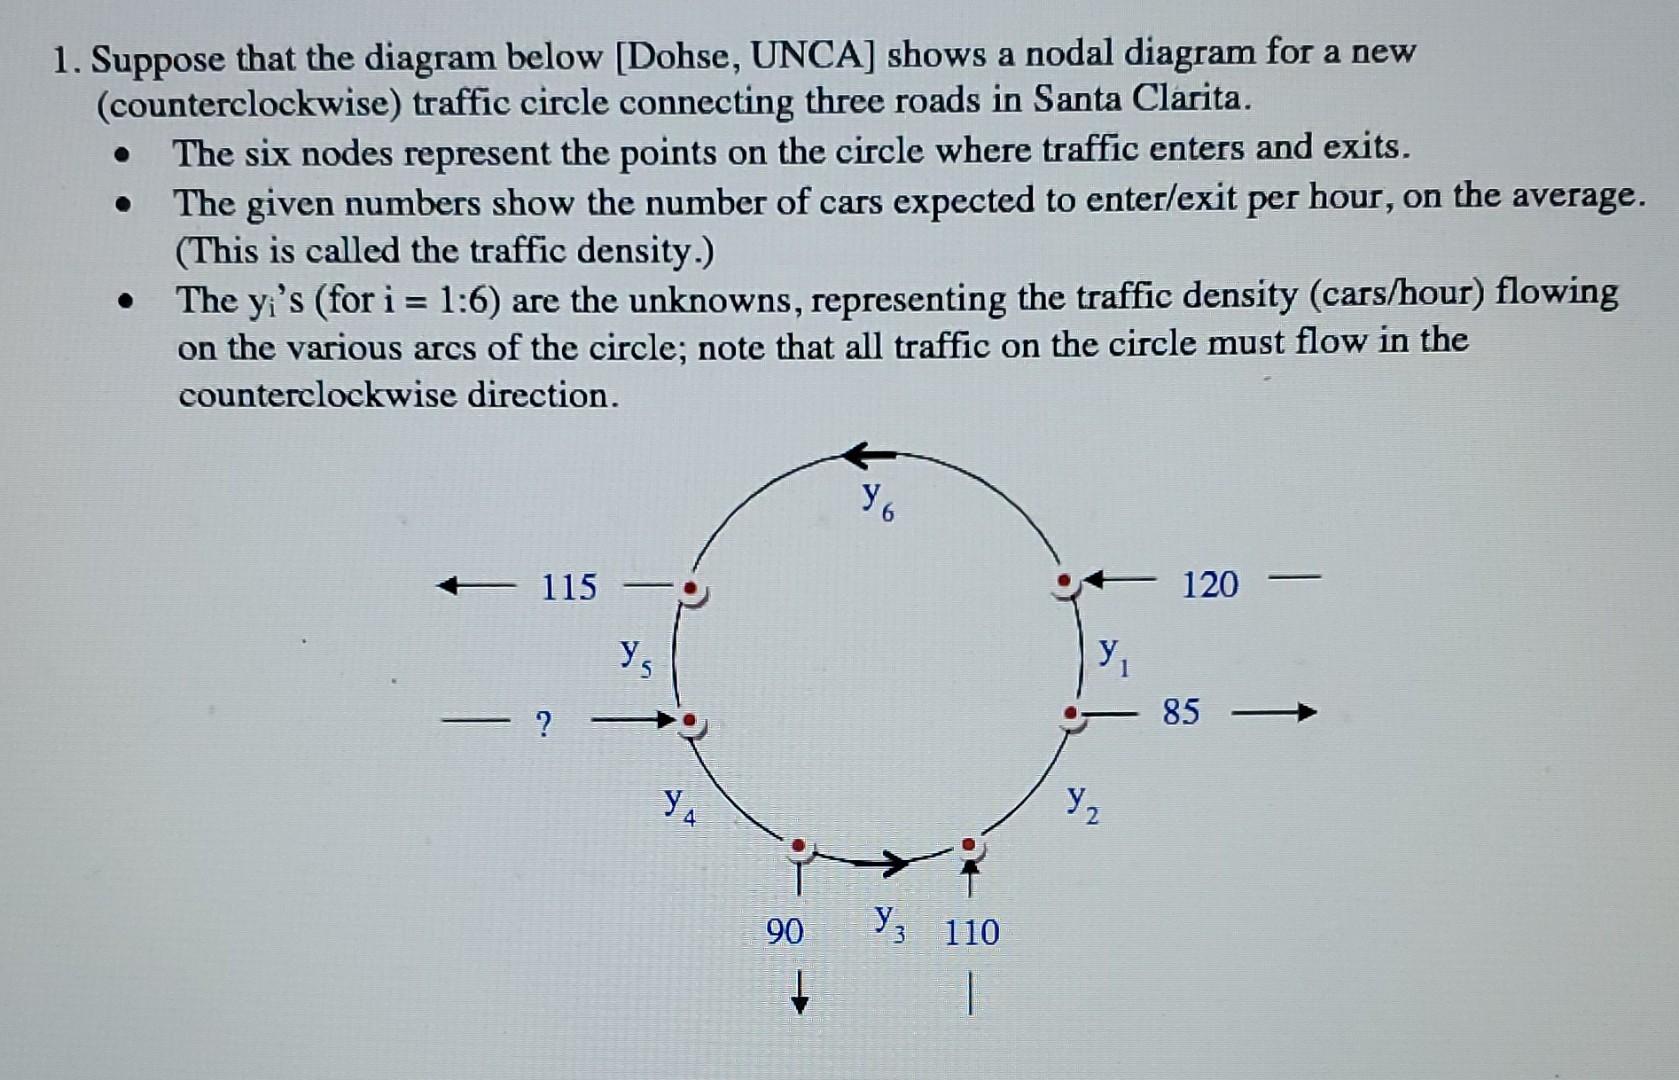
1. Suppose that the diagram below [Dohse, UNCA] shows a nodal diagram for a new (counterclockwise) traffic circle connecting three roads in Santa Clarita. - The six nodes represent the points on the circle where traffic enters and exits. - The given numbers show the number of cars expected to enter/exit per hour, on the average. (This is called the traffic density.) - The 's (for ) are the unknowns, representing the traffic density (cars/hour) flowing on the various arcs of the circle; note that all traffic on the circle must flow in the counterclockwise direction.
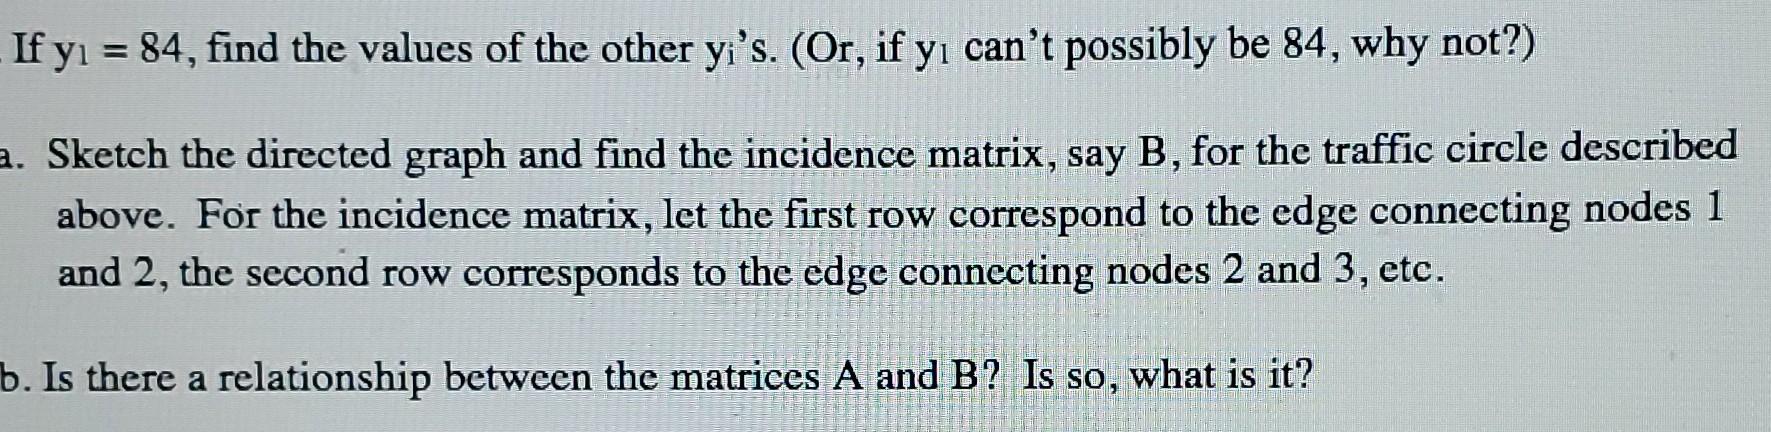
If , find the values of the other 's. (Or, if can't possibly be 84 , why not?) Sketch the directed graph and find the incidence matrix, say B, for the traffic circle described above. For the incidence matrix, let the first row correspond to the edge connecting nodes 1 and 2 , the second row corresponds to the edge connecting nodes 2 and 3 , etc. . Is there a relationship between the matrices A and B? Is so, what is it?