Home /
Expert Answers /
Mechanical Engineering /
note-student-number-last-digit-1-nbsp-4-plot-some-curves-with-matlab-plot-command-pl-pa240
(Solved): !!!! NOTE: STUDENT NUMBER LAST DIGIT 1 !!! 4. Plot some curves with Matlab (plot-command). Pl ...
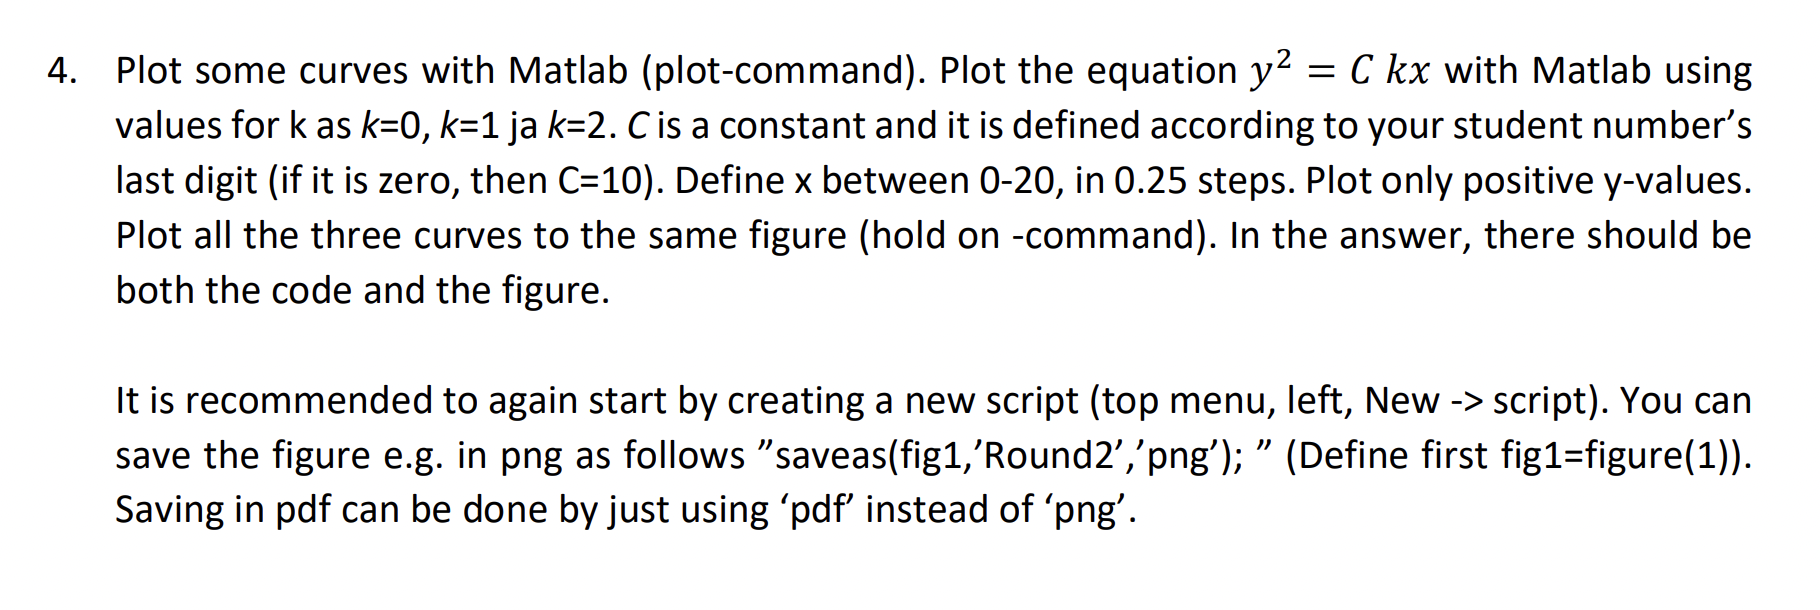
4. Plot some curves with Matlab (plot-command). Plot the equation \( y^{2}=C k x \) with Matlab using values for \( k \) as \( k=0, k=1 \) ja \( k=2 \). \( C \) is a constant and it is defined according to your student number's last digit (if it is zero, then \( \mathrm{C}=10 \) ). Define \( \mathrm{x} \) between \( 0-20 \), in \( 0.25 \) steps. Plot only positive \( y \)-values. Plot all the three curves to the same figure (hold on -command). In the answer, there should be both the code and the figure. It is recommended to again start by creating a new script (top menu, left, New -> script). You can save the figure e.g. in png as follows "saveas(fig1,'Round2', 'png'); " (Define first fig1=figure(1)). Saving in pdf can be done by just using 'pdf' instead of 'png'.
Expert Answer
MATLAB Code:- %clear screen, variables, and figures clc;clear variables;close a