Home /
Expert Answers /
Statistics and Probability /
o-random-variables-and-distributions-using-the-graph-of-a-distribution-to-find-probabilities-basi-pa117
(Solved): O RANDOM VARIABLES AND DISTRIBUTIONS Using the graph of a distribution to find probabilities: Basi ...
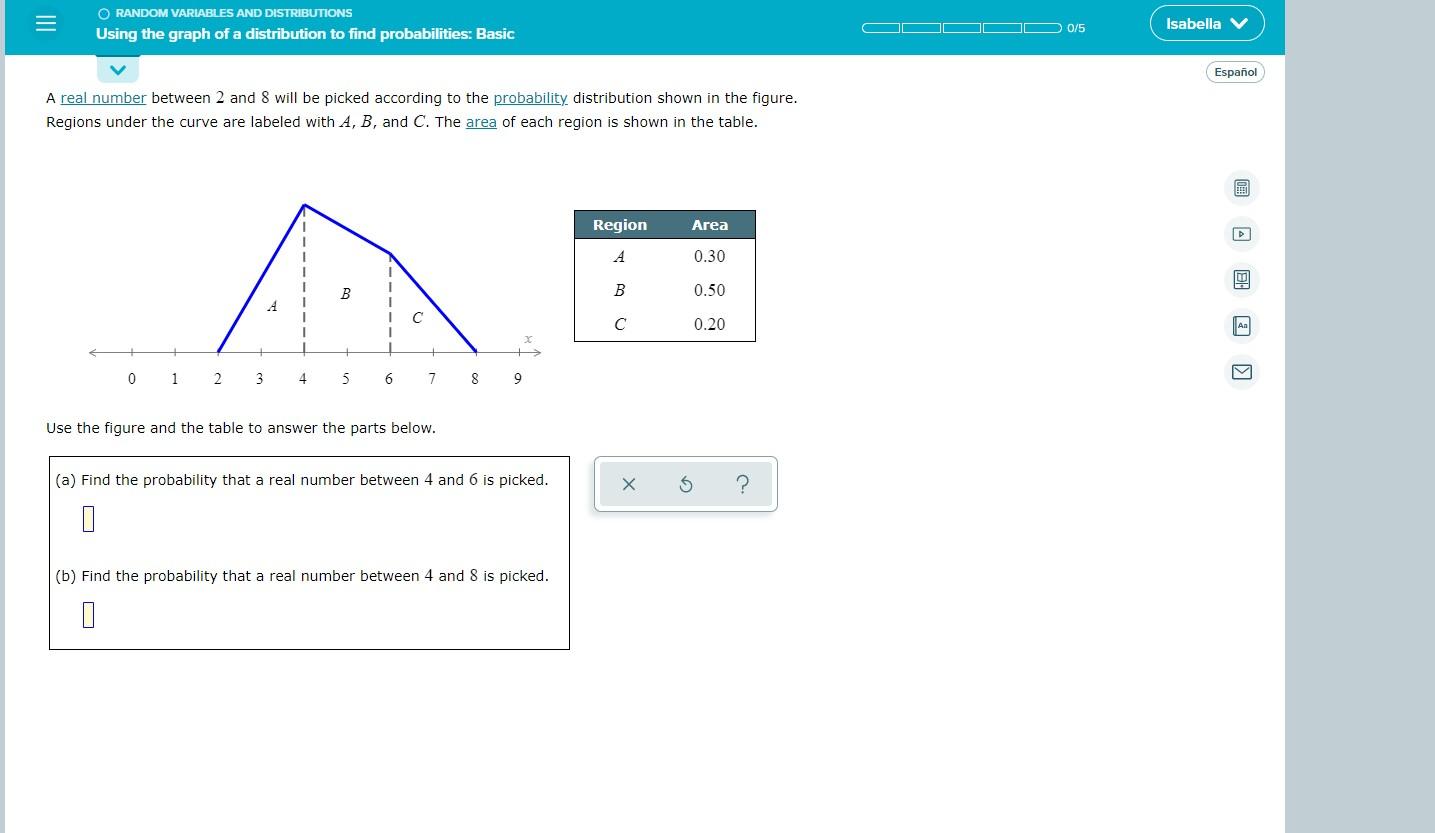
O RANDOM VARIABLES AND DISTRIBUTIONS Using the graph of a distribution to find probabilities: Basic A real number between 2 and 8 will be picked according to the probability distribution shown in the figure. Regions under the curve are labeled with A, B, and C. The area of each region is shown in the table. 0 1 2 3 A 4 B 5 1 C 1 6 7 Use the figure and the table to answer the parts below. 8 9 (a) Find the probability that a real number between 4 and 6 is picked. (b) Find the probability that a real number between 4 and 8 is picked. 0 Region A B C Area 0.30 0.50 0.20 ? 0/5 Isabella V Español 1 Aa V
Expert Answer
Solution:- Given that, according to the following probability distribution diagram, a real number from 2 to 8 is picked up. Also given the probabili