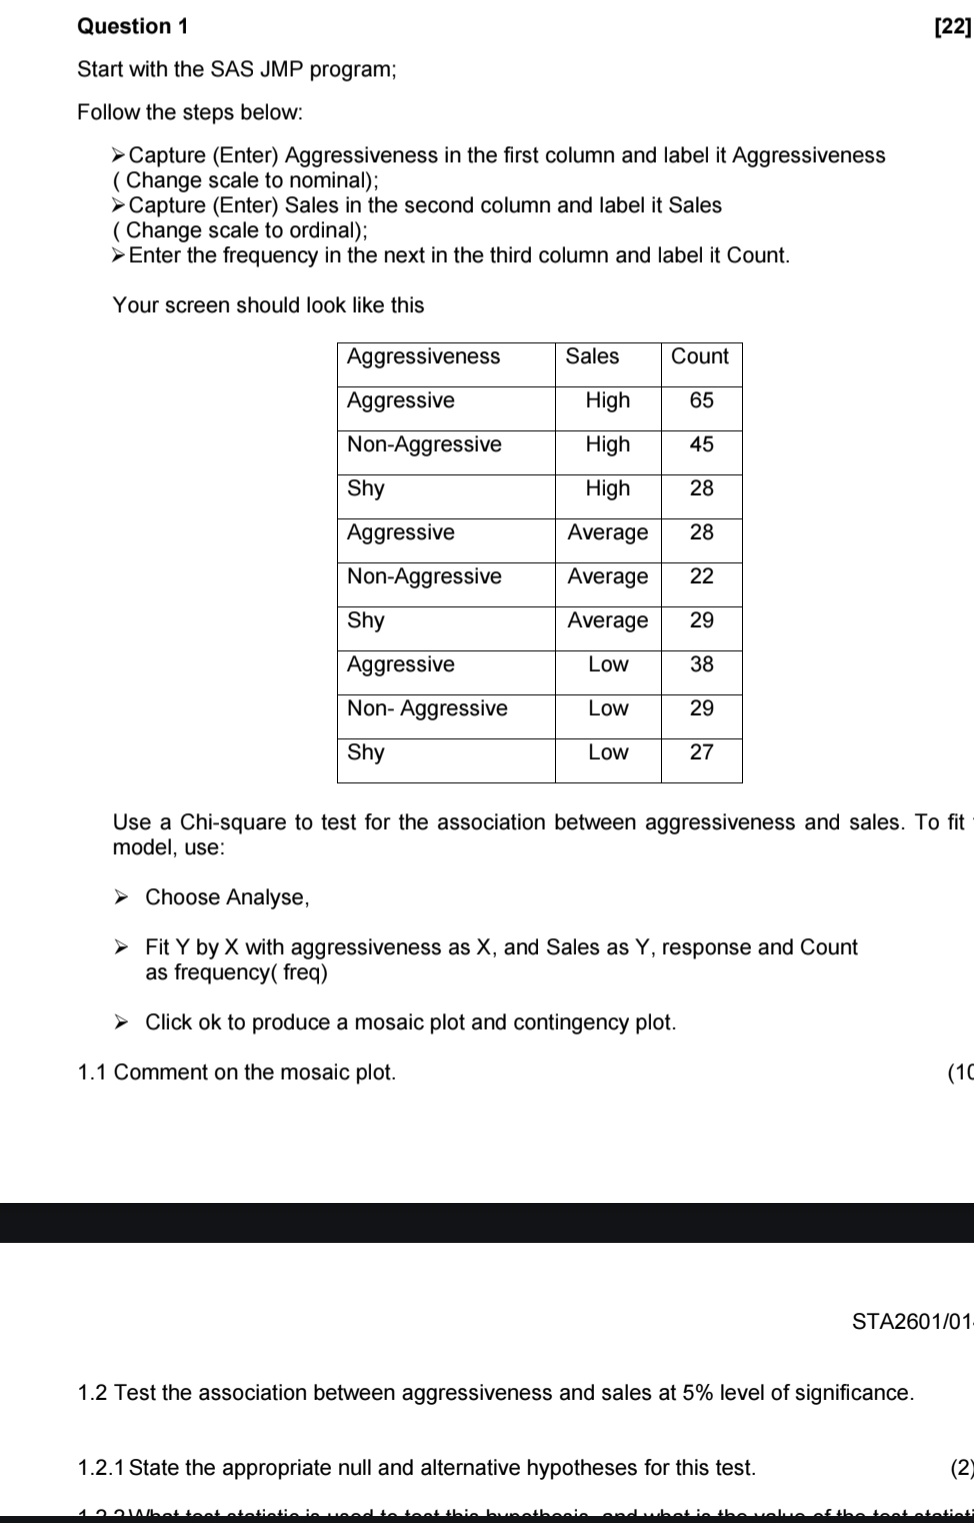
Question 1
[22]
Start with the SAS JMP program;
Follow the steps below:
Capture (Enter) Aggressiveness in the first column and label it Aggressiveness ( Change scale to nominal);
Capture (Enter) Sales in the second column and label it Sales
( Change scale to ordinal);
Enter the frequency in the next in the third column and label it Count.
Your screen should look like this
\table[[Aggressiveness,Sales,Count],[Aggressive,High,65],[Non-Aggressive,High,45],[Shy,High,28],[Aggressive,Average,28],[Non-Aggressive,Average,22],[Shy,Average,29],[Aggressive,Low,38],[Non- Aggressive,Low,29],[Shy,Low,27]]
Use a Chi-square to test for the association between aggressiveness and sales. To fit model, use:
Choose Analyse,
Fit Y by X with aggressiveness as X , and Sales as Y , response and Count as frequency( freq)
Click ok to produce a mosaic plot and contingency plot.
1.1 Comment on the mosaic plot.
(10
STA2601/01
1.2 Test the association between aggressiveness and sales at
5% level of significance.
1.2.1 State the appropriate null and alternative hypotheses for this test.
(2)