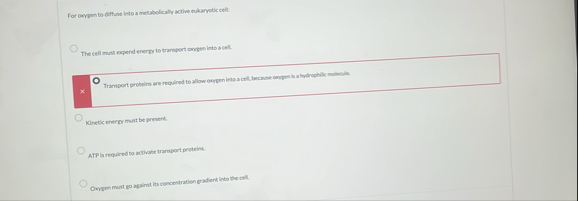
2.4 Table P2.4 shows financial statements for Apple (d) Quick (acid-test) ratio Computer Corporation. The closing stock price for (e) Inventory-turnover ratio Apple was $68.11 on September 30, 2013. The aver- (f) Day's-sales-outstanding age number of outstanding shares was 6.03 billion. (g) Total-assets-turnover ratio On the basis of the financial data presented, compute the various financial ratios and make an informed (h) Profit margin on sales analysis of Apple's financial health. (i) Return on total assets (a) Debt ratio ()) Return on common equity (b) Times-interest-earned ratio (k) Pricelearnings ratio (c) Current ratio (1) Book value per share TABLE P2.4 Financial Statements for Apple Computer (All numbers in thousands) THE BALANCE SHEET STATEMENT Period Ending Sep 28, 2013 Sep 29, 2012 Cash And Cash Equivalents Short Term Investments $14.259.000 $ 10,746,000 26,287.000 18.383.000 Net Receivables 24.094,000 21.275,000 Inventory 1.764,000 791,000 Other Current Assets 6,882.000 6,458,000 Total Current Assets $ 73,286,000 $ 57,653,000 Long Term Investments 106,215,000 92,122,000 Property Plant and Equipment 16,597.000 15.452.000 Goodwill 1.577.000 1.135.000 Intangible Assets 4,179.000 4,224,000 Other Assets 5.146.000 5,478,000 Total Assets $207,000,000 $176,064,000 36.223,000 32,589.000 Accounts Payable Short/Current Long Term Debt Other Current Liabilities 7.435.000 5,953,000 Total Current Liabilities $ 43,658,000 $ 38,542.000 Long Term Debt 16.960,000 Other Liabilities 20.208,000 16,664.000 Deferred Long Term Liability Charges 2.625.000 2.648,000 Total Liabilities $ 83.451,000 $ 57,854,000 Common Stock 19.764,000 16.422.000 Retained Earnings 104,256,000 101,289,000 Treasury Stock Capital Surplus Other Stockholder Equity (471,000) 499,000 Total Stockholder Equity $123,549,000 $118,210,000 Total Liabilities and Stockholders' Equity $207,000,000 $176,064,000 Income Statement Total Revenue $170,910,000 $156,508,000 Cost of Revenue 106,606,000 87.846,000 Gross Profit $ 64,304,000 $ 68,662,000 (continued Sep 29, 2012 TABLE P2.4 (continued) THE BALANCE SHEET STATEMENT Sep 28, 2013 4.475,000 3,381,000 10,040,000 Period Ending 10,830,000 $ 55,241,000 $ 48,999,000 522,000 1.156,000 Research Development Selling General and Administrative Operating Income or Loss Total Other Income/Expenses Net Earnings Before Interest And Taxes 55.763,000 50,155,000 55,763,000 Interest Expense 50,155,000 Income Before Tax 14,030,000 13.118,000 Income Tax Expense Minority Interest Net Income From Continuing Ops 41,733,000 37,037,000 $ 41,733,000 $ 37,037,000 Net Income Preferred Stock And Other Adjustments $ 37,037,000 $ 41,733,000 Net Income Applicable To Common Shares Source: Data from Apple Reports Fourth Quarter Results, Apple, October 28, 2013.