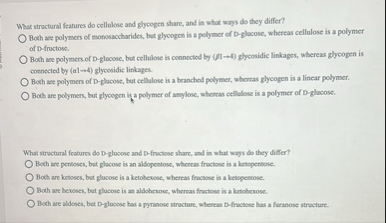
What structural features do cellulose and glycogen share, and in what ways do they differ?
? Both are polymers of monosaccharides, but glycogen is a polymer of D-glacose, whereas cellulose is a polymer of D-fructose.
? Both are polymers. Of D-glocose, bot cellulose is connectod by (
91-4 ) phyosidic linkages, whereas glycogen is connected by
(a1->4) glycosidic linkages.
? Both ae polymers of D-glucose, but cellulose is a branched polymer, whereas glycogen is a linear polymer.
? Both are polymers, but glycogen ig a polymer of amylose, whereas eell.lose is a polymer of D-glucose.
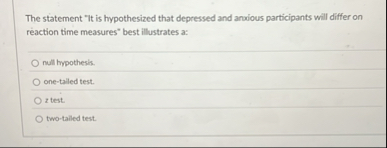
What structural features do D-glucose and D-fractose share, and in what ways do they differ?
? Both are pertoses, but glacose is an aldopentose, whereas fractose is a ketopentose.
? Both are ketoses, but plucose is a ketohesese, whereas factose is a ketapemose.
? Both are hewoses, but glucose is an aldohesose, whereas froctose is a ketchenose.
? Both are aldeses, bet D-glucose has a pyranose structure, whereas D-fructuse has a fur anose structure.