(Solved): Part 3: Local Precipitation Patterns 11. The attached map shows annual precipitation (mm) in SW BC. ...
Part 3: Local Precipitation Patterns
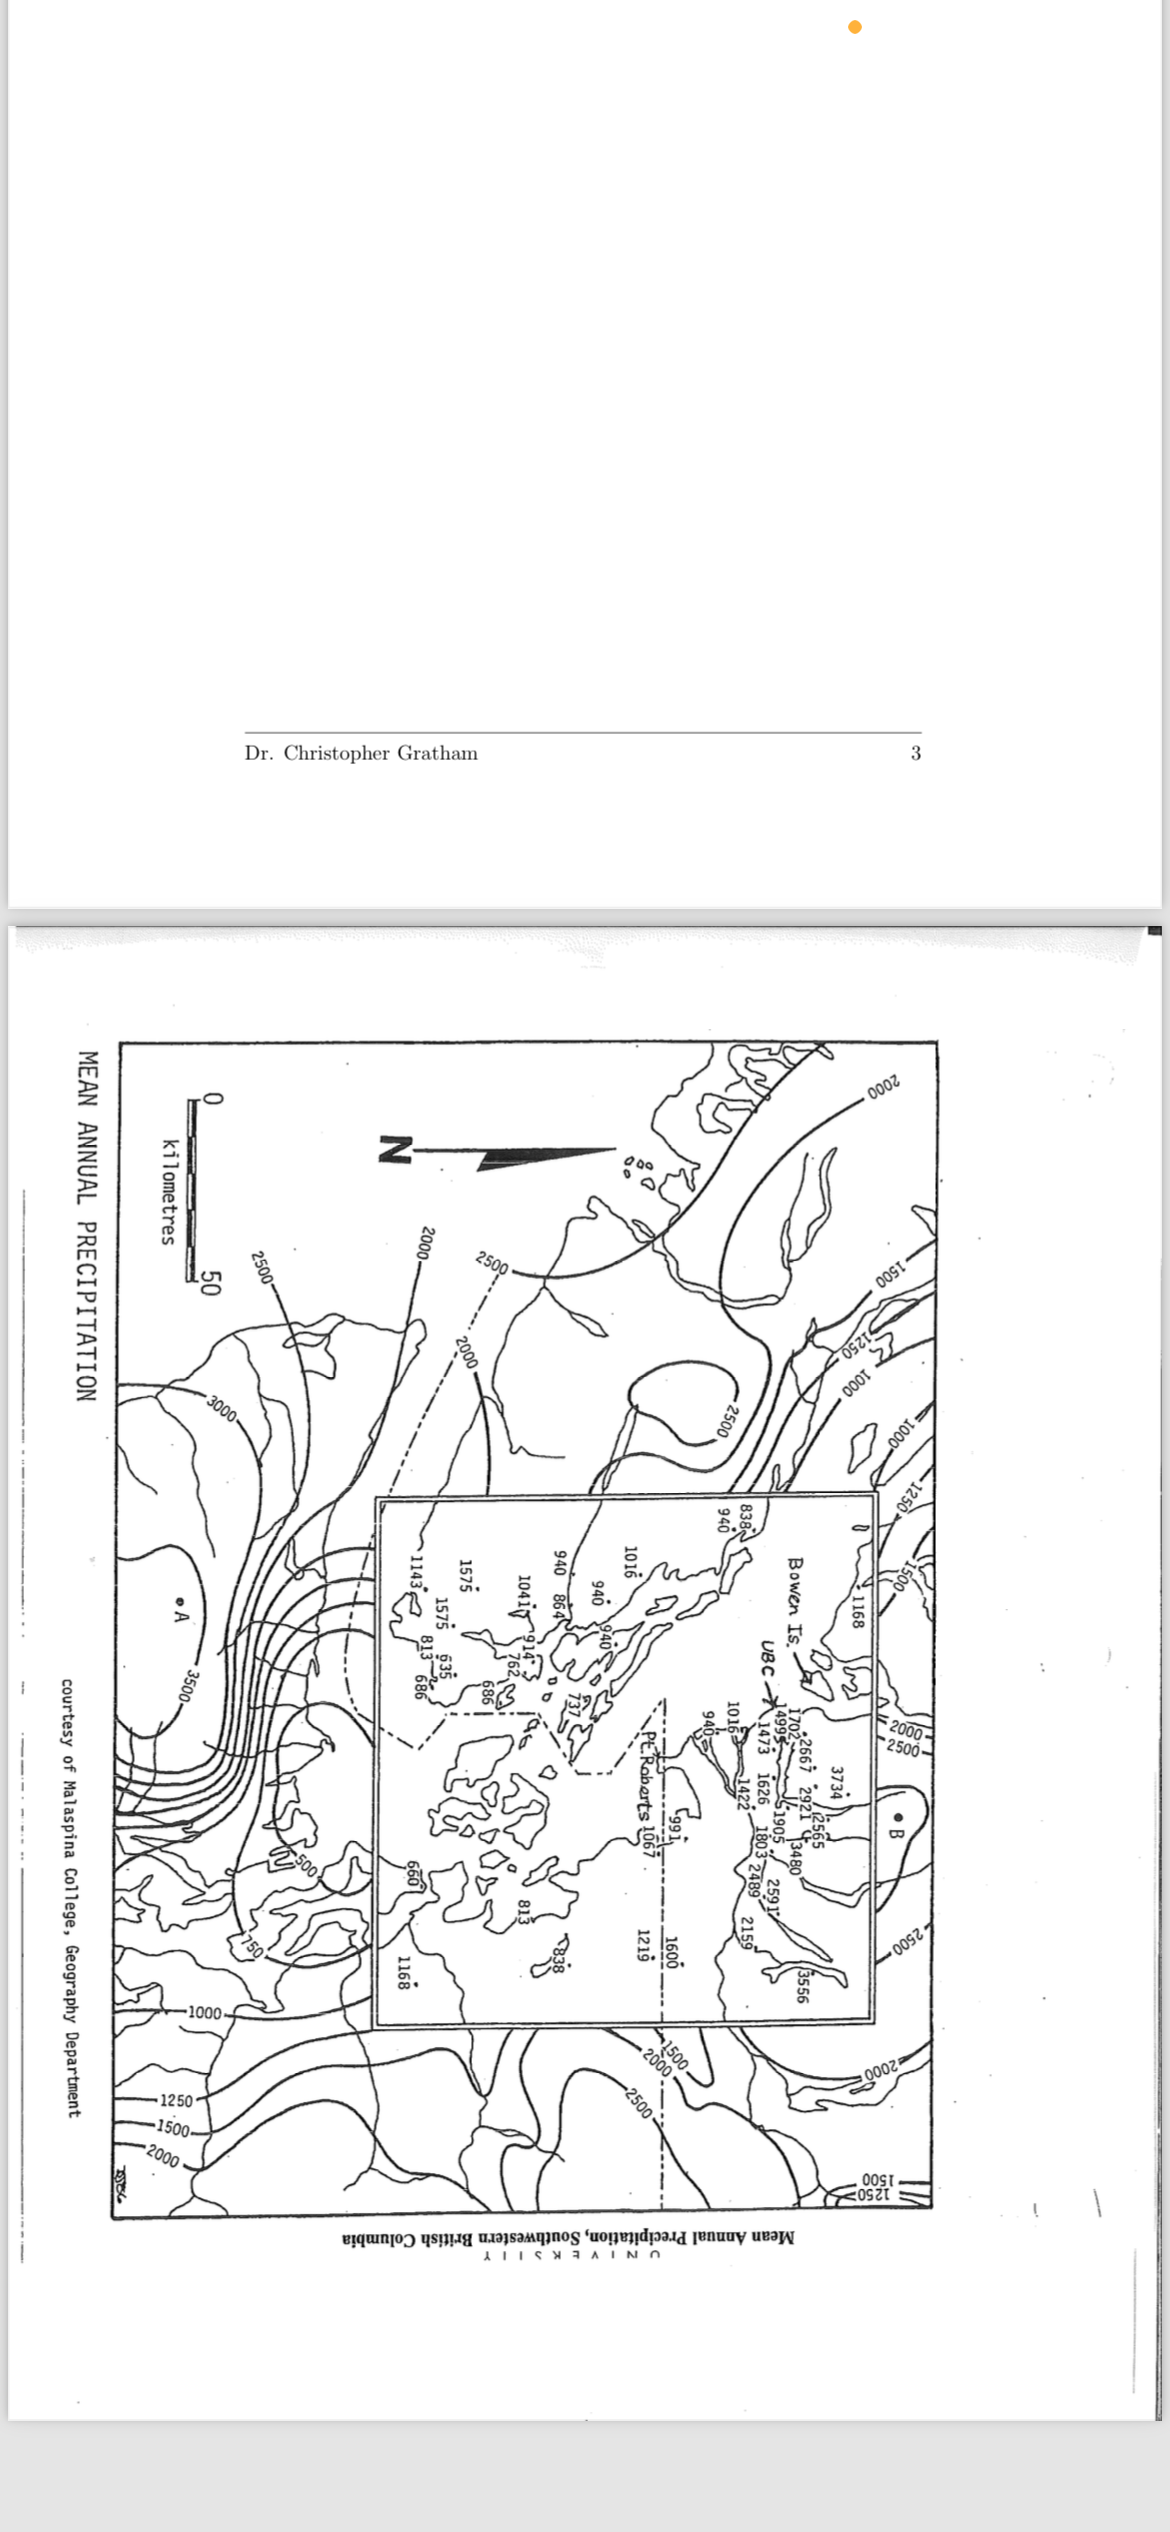
11. The attached map shows annual precipitation (mm) in SW BC. Con- tours of equal precipitation (called isohyets) are shown with a section removed and the actual values plotted. In the missing area, draw isohyets at 250mm intervals up to 1500mm. Above 1500mm change the interval to 500mm to improve legibility. When drawing the iso- hyets make sure you follow rules of contouring and also include your knowledge of of topography and its influence of precipitation
12. From your map, estimate,ate the annual precipitation at a) UBC, b) Capilano U, c) Point Roberts, and C) Bowen Island.
13. Briefly account for the high precipitation along the north side of the Fraser River Valley (make sure to take into account all you know, including insights from Part 1).
map used for this question is :9aNOR
Mean Annual Precipitation, Southwestern British Columbia this is the name of the map