Home /
Expert Answers /
Other Math /
part-a-the-following-table-shows-quarterly-sales-in-thousand-units-for-a-product-over-5-years-t-pa397
(Solved): PART A The following table shows quarterly sales (in thousand units) for a product over 5 years. T ...
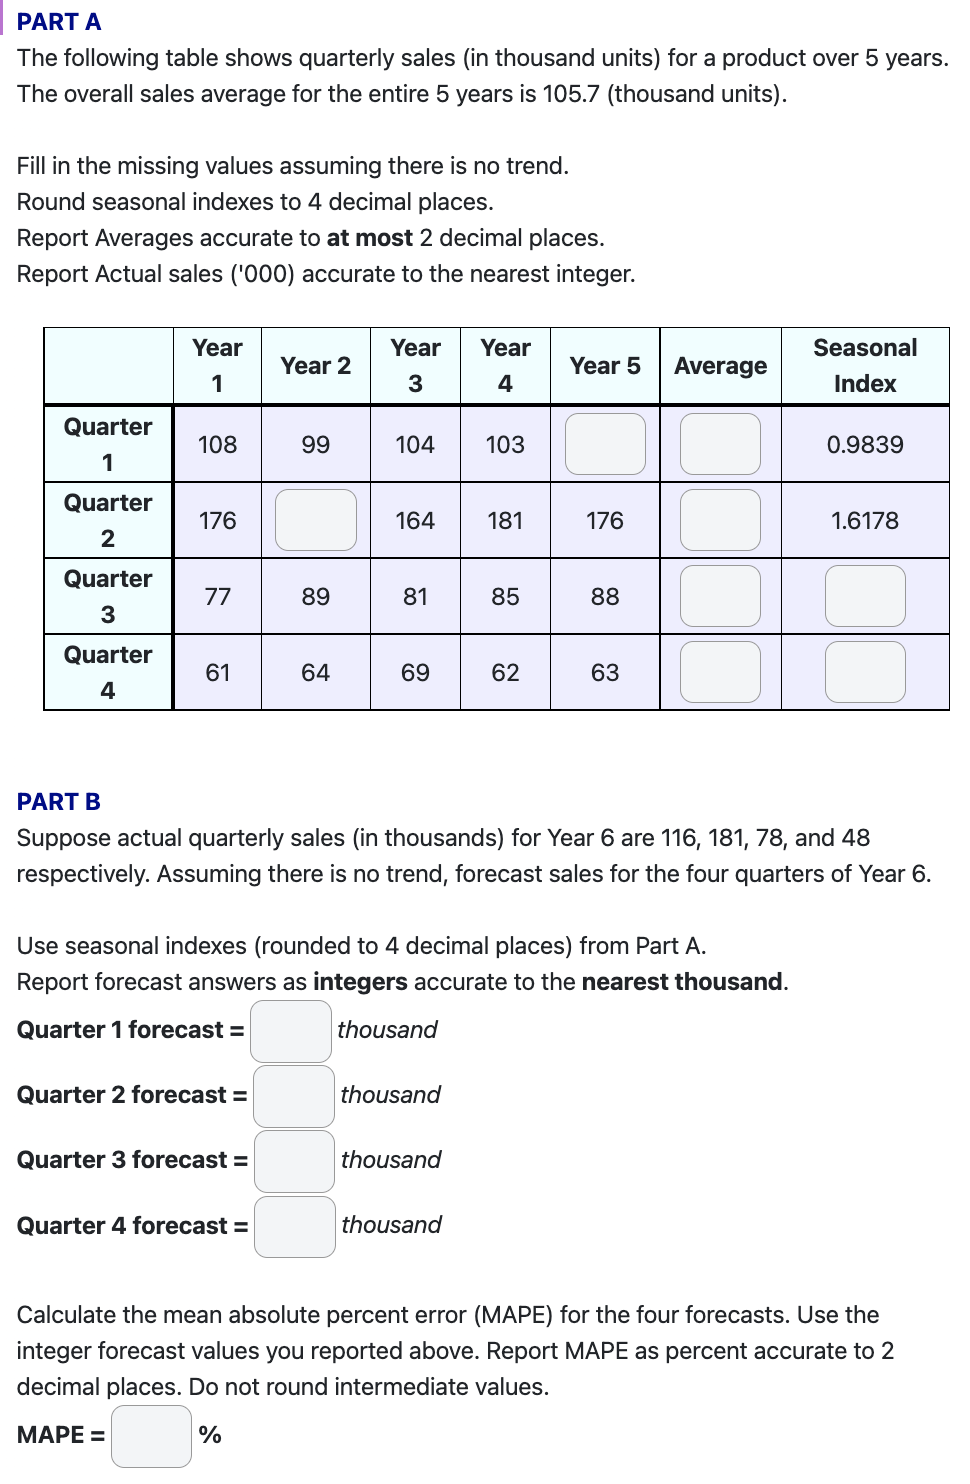
PART A The following table shows quarterly sales (in thousand units) for a product over 5 years. The overall sales average for the entire 5 years is \( 105.7 \) (thousand units). Fill in the missing values assuming there is no trend. Round seasonal indexes to 4 decimal places. Report Averages accurate to at most 2 decimal places. Report Actual sales ('000) accurate to the nearest integer. PART B Suppose actual quarterly sales (in thousands) for Year 6 are 116, 181, 78, and 48 respectively. Assuming there is no trend, forecast sales for the four quarters of Year 6. Use seasonal indexes (rounded to 4 decimal places) from Part A. Report forecast answers as integers accurate to the nearest thousand. Quarter 1 forecast \( =\quad \) thousand Quarter 2 forecast = \( \quad \) thousand Quarter 3 forecast \( =\quad \) thousand Quarter 4 forecast \( =\quad \) thousand Calculate the mean absolute percent error (MAPE) for the four forecasts. Use the integer forecast values you reported above. Report MAPE as percent accurate to 2 decimal places. Do not round intermediate values. MAPE \( =\quad \% \)
Expert Answer
Part A Given Overall sales average = 105.7 Average: Q3=77+89+81+85+885=4205=84 Q4=61+64+69+62+635=3195=63.8 Q1=overa