Home /
Expert Answers /
Statistics and Probability /
please-answer-part-d-the-accompanying-data-resulted-from-an-experiment-to-investigate-whether-yield-pa421
(Solved): Please answer part D. The accompanying data resulted from an experiment to investigate whether yield ...
Please answer part D.
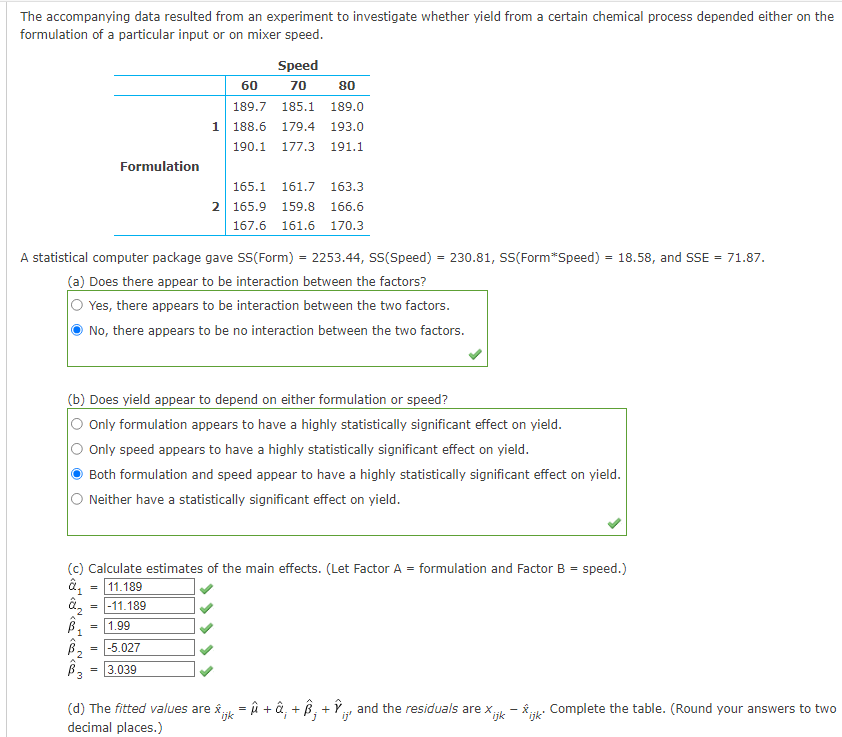
The accompanying data resulted from an experiment to investigate whether yield from a certain chemical process depended either on the formulation of a particular input or on mixer speed. A statistical computer package gave SS(Form) (Speed) (Form* peed) , and SSE . (a) Does there appear to be interaction between the factors? Yes, there appears to be interaction between the two factors. No, there appears to be no interaction between the two factors. (b) Does yield appear to depend on either formulation or speed? Only formulation appears to have a highly statistically significant effect on yield. Only speed appears to have a highly statistically significant effect on yield. Both formulation and speed appear to have a highly statistically significant effect on yield. Neither have a statistically significant effect on yield. (c) Calculate estimates of the main effects. (Let Factor formulation and Factor speed.) (d) The fitted values are and the residuals are Complete the table. (Round your answers to two decimal places.)
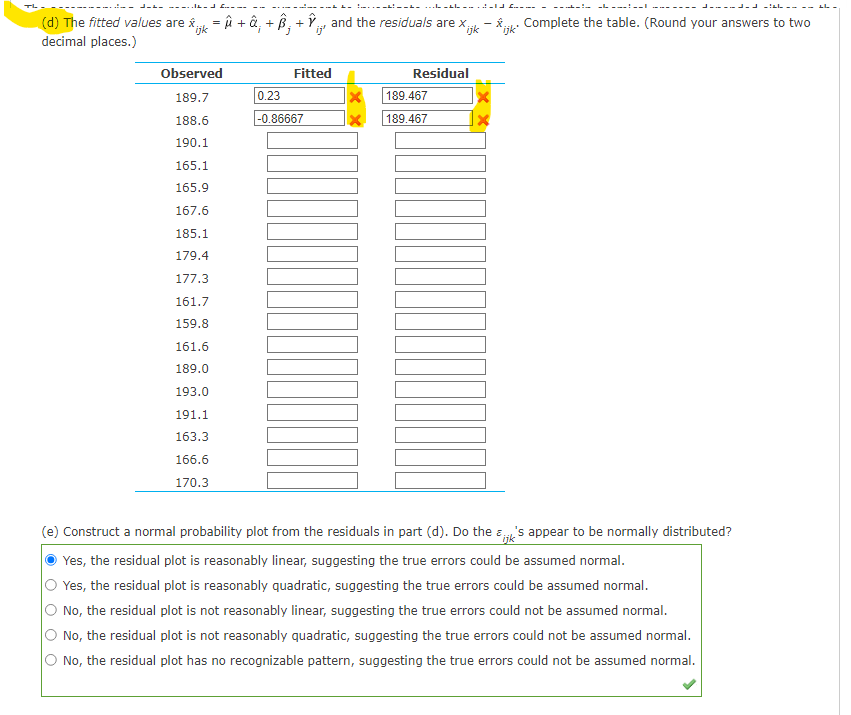
(d) The fitted values are and the residuals are . Complete the table. (Round your answers to two decimal places.) (e) Construct a normal probability plot from the residuals in part (d). Do the 's appear to be normally distributed? Yes, the residual plot is reasonably linear, suggesting the true errors could be assumed normal. Yes, the residual plot is reasonably quadratic, suggesting the true errors could be assumed normal. No, the residual plot is not reasonably linear, suggesting the true errors could not be assumed normal. No, the residual plot is not reasonably quadratic, suggesting the true errors could not be assumed normal. No, the residual plot has no recognizable pattern, suggesting the true errors could not be assumed normal.
Expert Answer
(d) The fitted value sare