Home /
Expert Answers /
Economics /
please-help-and-solve-the-questions-and-graph-2-calculating-marginal-revenue-from-a-linear-demand-c-pa836
(Solved): please help and solve the questions and graph 2. Calculating marginal revenue from a linear demand c ...
please help and solve the questions and graph
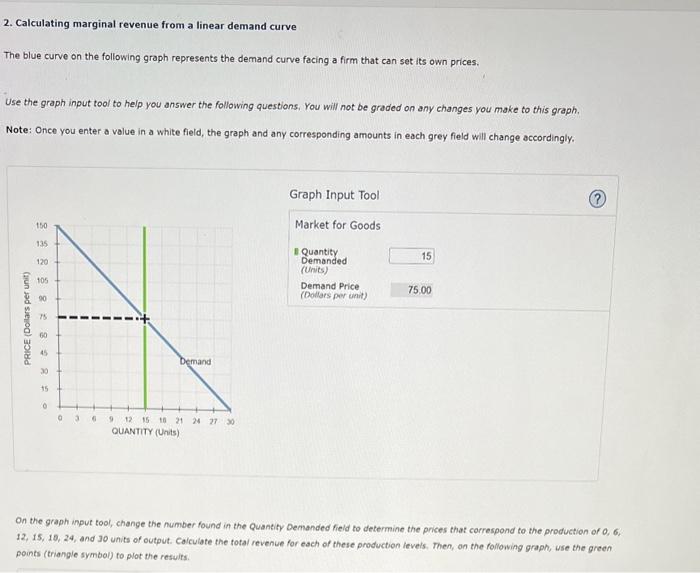
2. Calculating marginal revenue from a linear demand curve The blue curve on the following graph represents the demand curve facing a firm that can set its own prices. Use the graph input tool to help you answer the following questions, You will not be graded on any changes you make to this graph. Note: Once you enter a volue in a white field, the graph and any corresponding amounts in each grey field will change accordingly. Graph Input Tool Market for Goods I Quantity Demanded (Units) Demand Price (Dollars per unit) On the graph input tool, change the number found in the Quantity Demanded field to determine the prices that correspond to the production of 0,6 . 12, 15, 15, 24, and 30 units of output. Calculate the total revenue for esch of these production levels. Then, on the following graph, use the green points (triangle symbol) to plot the results.
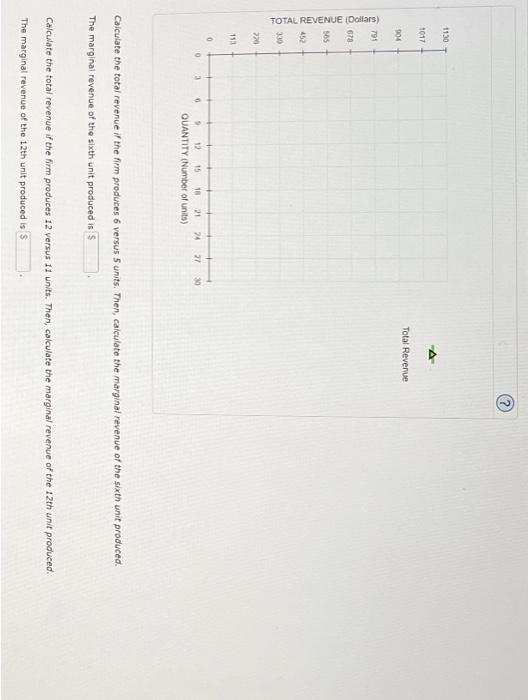
Caiculate the total revenue if the fimm produces 6 versus 5 units. Then, calculate the marginal revenue of the sixth unit produced. The marginal revenue of the sixth unit produced is Calculate the fotal revenue if the firm produces 12 versus 11 units. Then, calculate the marginal revenue of the 12 th unit produced. The marginal revenue of the 12 th unit produced is
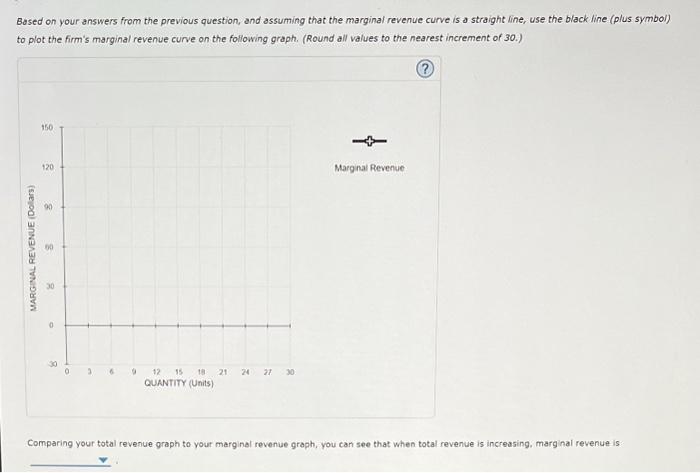
Bosed on your answers from the previous question, and assuming that the marginal revenue curve is a straight line, use the black line (plus symbol) to plot the firm's marginal revenue curve on the following graph. (Round all values to the nearest increment of 30 .) Comparing your total revenue graph to your marginel revenue graph, you can see that when total revenue is increasing, marginal revenue is
Expert Answer
Answer:Given: Graph representing the demand curve.By using the graph Let's find the value of Prices that correspond to the production of 0, 6, 12, 15, 18, 24, and 30. And then we will calculate the total revenue for each of these production levels.? At production level 0, The price is $150, ? At production level 6, The price is $120, ? At production level 12, The price is $90, ? At production level 15, The price is $75, ? At production level 18, The price is $60, ? At production level 24, The price is $30, ? At production level 30, The price is $0, Following is the graph representing Total Revenue Curve: