Home /
Expert Answers /
Physics /
please-plot-a-graph-of-the-square-of-the-final-velocity-versus-2-delta-s-for-each-run-for-constant-pa576
(Solved): Please Plot a graph of the square of the final velocity versus 2\Delta s for each run. For constant ...
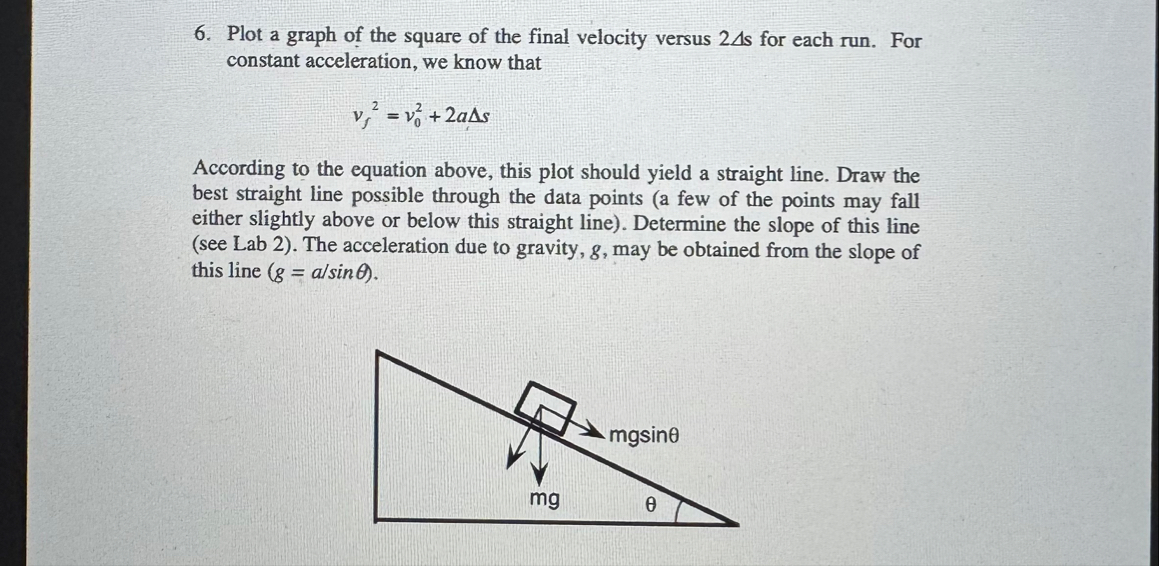
Please Plot a graph of the square of the final velocity versus
2\Delta s for each run. For constant acceleration, we know that
v_(f)^(2)=v_(0)^(2) 2a\Delta sAccording to the equation above, this plot should yield a straight line. Draw the best straight line possible through the data points (a few of the points may fall either slightly above or below this straight line). Determine the slope of this line (see Lab 2). The acceleration due to gravity,
g, may be obtained from the slope of this line (
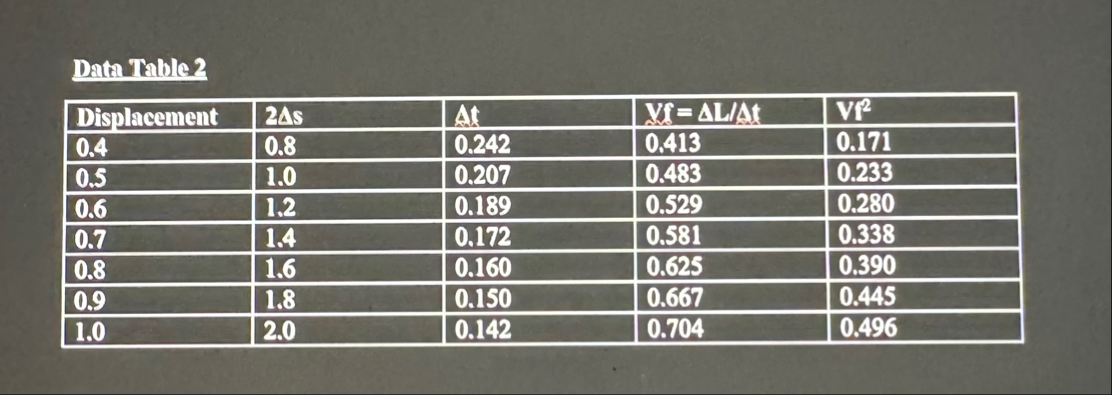
g=(a)/(sin\theta )).Data Tables \table[[Displacement,24s,
\Delta t,
M=\Delta (L)/(\Delta )t,V
^(2)