Home /
Expert Answers /
Advanced Math /
please-solve-asap-solar-panel-power-output-the-graph-of-the-function-f-shown-in-the-accompanying-fig-pa604
(Solved): PLEASE SOLVE ASAP Solar Panel Power Output The graph of the function f shown in the accompanying fig ...
PLEASE SOLVE ASAP
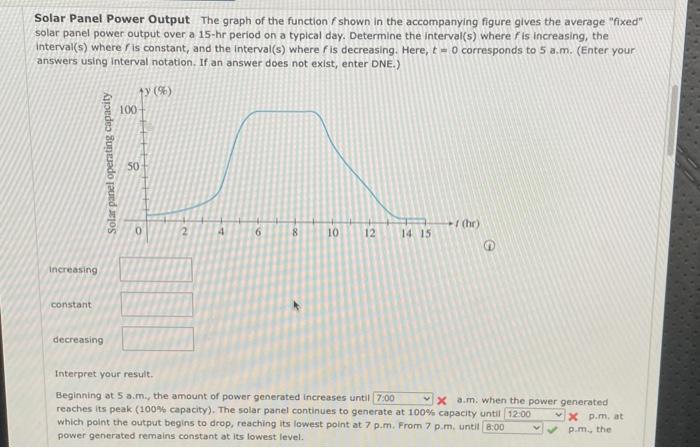
Solar Panel Power Output The graph of the function shown in the accompanying figure gives the average "fixed" solar panel power output over a 15 -hr period on a typical day. Determine the interval(s) where is increasing, the interval(s) where is constant, and the interval(s) where is decreasing. Here, corresponds to 5 a.m. (Enter your answers using interval notation. If an answer does not exist, enter DNE.) increasing constant decreasing Interpret your result. Beginning at 5 aim, the amount of power generated increases until X a.m. when the power generated reaches its peak ( capacity). The solar panel continues to generate at capacity until which point the output begins to drop, reaching its lowest point at 7 p.m. From 7 p.m. unti p.m, at power generated remains constant at its lowest level. P.m. the