Home /
Expert Answers /
Computer Science /
python-linear-regression-case-study-boston-housing-price-prediction-problem-statement-the-problem-a-pa931
(Solved): python linear regression Case Study: Boston Housing Price Prediction Problem Statement The problem a ...
python linear regression
Case Study: Boston Housing Price Prediction Problem Statement The problem at hand is to predict the housing prices of a town or a suburb based on the features of the locality provided to us. In the process, we need to identify the most important features in the dataset. We need to employ techniques of data preprocessing and build a linear regression model that predicts the prices for us. Data Information Each record in the database describes a Boston suburb or town. The data was drawn from the Boston Standard Metropolitan Statistical Area (SMSA) in 1970. Detailed attribute information can be found below- Attribute Information (in order): CRIM: per capita crime rate by town .ZN: proportion of residential land zoned for lots over 25,000 sq.ft. • INDUS: proportion of non-retail business acres per town • CHAS: Charles River dummy variable ( 1 if tract bounds river: 0 otherwise) NOX: nitric oxides concentration (parts per 10 million) • RM: average number of rooms per dwelling AGE: proportion of owner-occupied units built prior to 1940 DIS: weighted distances to five Boston employment centres RAD: Index of accessibility to radial highways • TAX: full-value property-tax rate per 10,000 dollars • PTRATIO: pupil-teacher ratio by town LSTAT: lower status of the population • MEDV: Median value of owner-occupied homes in 1000 dollars.
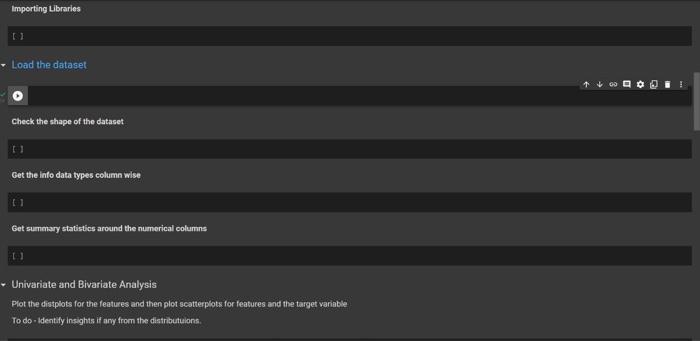
Importing Libraries Load the dataset Check the shape of the dataset Get the info data types column wise Get summary statistics around the numerical columns 11 ? Univariate and Bivariate Analysis Plot the distplots for the features and then plot scatterplots for features and the target variable To do - Identify insights if any from the distributions.
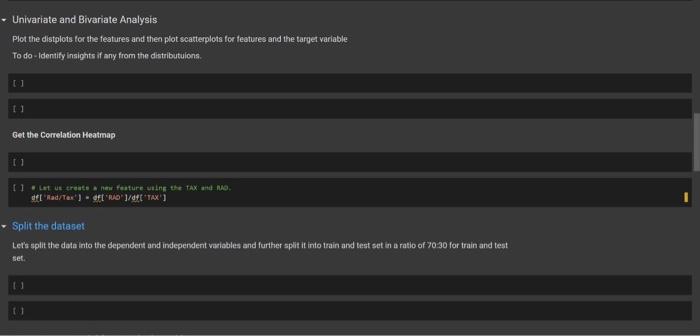
? Univariate and Bivariate Analysis Plot the distplots for the features and then plot scatterplots for features and the target variable To do-Identify insights if any from the distributions. [] Get the Correlation Heatmap [] Let us create a new feature using the TAX and MO df[Rad/Tax]df["RAD"]/df["TAX"] ? Split the dataset Let's split the data into the dependent and independent variables and further split it into train and test set in a ratio of 70:30 for train and test set. 33
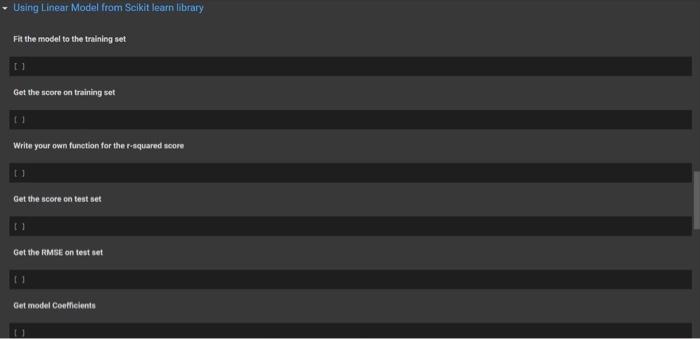
Using Linear Model from Scikit learn library Fit the model to the training set Get the score on training set Write your own function for the r-squared score Get the score on test set Get the RMSE on test set Get model Coefficients
Automate the equation of the fit Bonus: Using Statsmodels OLS Make the linear model using OLS Get the value of coefficient of determination Get the Predictions on test set Calculate MSE for training set
Get the value of coefficient of determination Get the Predictions on test set Calculate MSE for training set Get the RMSE on training set Get the RMSE on test set
Expert Answer
import numpy as np import pandas as pd from sklearn.datasets import load_boston boston = load_boston() df = pd.DataFrame(data=boston.data, columns=boston.feature_names) df["target"] = boston.target prices = boston.target df.shape df.info() df.hea