Home /
Expert Answers /
Operations Management /
quality-engineering-teach-me-step-by-step-the-data-in-the-table-below-represent-the-production-q-pa621
(Solved): Quality Engineering teach me step by step The data in the table below represent the production q ...
Quality Engineering
teach me step by step
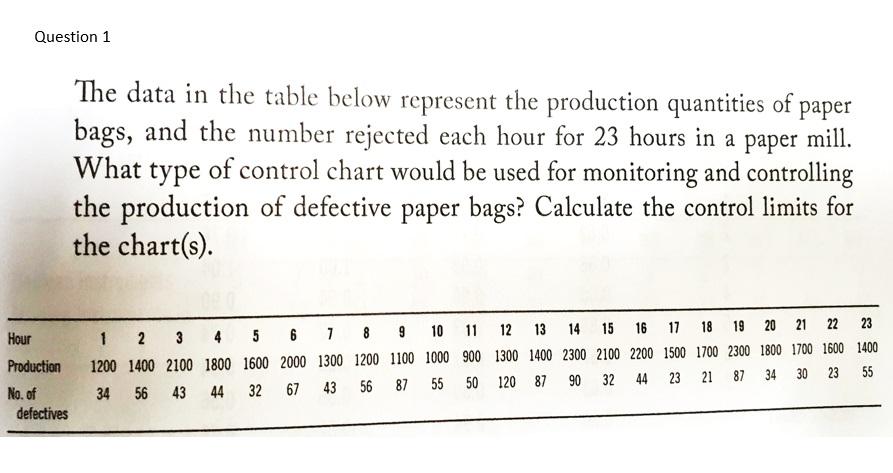
The data in the table below represent the production quantities of paper bags, and the number rejected each hour for 23 hours in a paper mill. What type of control chart would be used for monitoring and controlling the production of defective paper bags? Calculate the control limits for the chart(s).
Expert Answer
Step 1Data – discrete or continuousHere we are segregating defective units from normal units.The data is binomial- normal or effective. D